$25.00
Click on the image to the left
to get a better view.
See description lower on this page.
Description
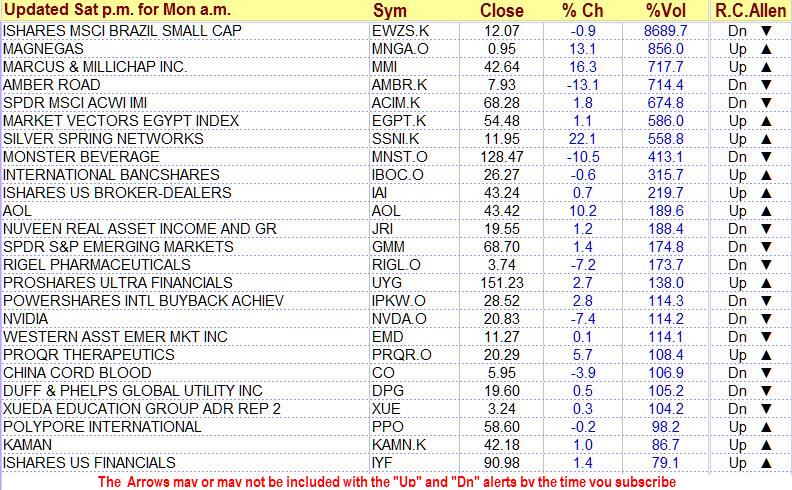
With this subscription we list alerts generated by R.C.Allen’s 4x9x18 triple moving average crossover alert system. The system used was first introduced and made popular by R.C. Allen (How to Build A Fortune in Commodities) as an effective tool for trading both stocks and commodities. To create the lists, we scan thousands of stocks. The lists are ranked in order of the magnitude of the surge in volume, with the greatest volume surges at the top of the list.
The Alert System Used is as follows.
1.) An “Up Alert” means that the 4-day MA is above the 9-day MA and the 9-day MA is above the 18-day MA. — If a stock is rising, its shorter moving averages will move up faster than its longer moving averages. Waiting for all moving averages to align correctly gives time for momentum to build, and it helps a potential buyer avoid some false starts. This is one of the ways the strategy incorporates discipline. The alert to a possible “buy” signal occurs when the 4-day moving average crosses above the 9-day moving average. The actual buy signal occurs when the 9-day moving average crosses above the 18-day moving average while the 4-day moving average is still above the 9-day moving average. If at the time the 9-day moving average crosses above the 18-day moving average, the 4-day moving average is below the 9-day moving average, there is no signal unless and until the 4-day moving average crosses back above the 9-day. Conversely, a “Down Alert” means that the 4-day moving average is below the 9-day moving average and the 9-day moving average has just crossed below the 18-day MA.
2.) Furthermore, an “Up Alert” means that the 9-day moving average was recently below the 18-day moving average. — This implies the stock was recently declining and may be just beginning to rise. Here, the idea is to catch a stock at the beginning of a new trend. A “Down Alert” means that the 9-day moving average was recently above the 18-day moving average. This implies the stock was recently rising and may be just beginning to decline.
3.) R.C. Allen said that “In a bull market, the volume of sales should increase as prices rise. If the volume does not increase, it may be a false move or ‘trap.’ Even though your charts may show a ‘breakout’ towards higher levels, the up move should never be trusted unless it occurs with an increase in the volume of the sales.” The same thing can be said of down moves. If volume declines on a down move, that move should not to be trusted. Under the heading “Vol %” we give the 1-day change in volume on the day the 9-day moving average crossed the 18-day moving average.
4.) R.C. Allen only required the alignment of moving averages as described in item 1. What if you have an “Up Alert” in which the 4-day moving average is above the 9-day moving average but declining? This could be an indication that the signal may result in a whipsaw (a sell signal shortly after the buy signal). Some people will, therefore, wait for the 4-day moving average to be rising att he same time it is above the 9-day average. You can screen out such “setups” by looking at a chart with the 4-day moving average plotted. A stock is listed as giving an alert based on a strict compliance with Allen’s system. However, in addition to the proper alignment of moving averages, you may use the 4-day moving average to provide added confirmation of the signal by requiring that it also be moving in the direction of the crossover.
5.) The “R.C. Allen” column identifies the type of alert generated (Up or Dn).
R.C. Allen’s system has been used successfully by thousands of traders over many years.
Lists: The lists could have up to 100 stocks when the market surges, but the list often has less than 20 stocks. Most of the time, probably 10 to 20 stocks are listed. Of course, there is a new list every week.


