$25.00
Click on the image to the left
to get a better view.
See description lower on this page.
Description
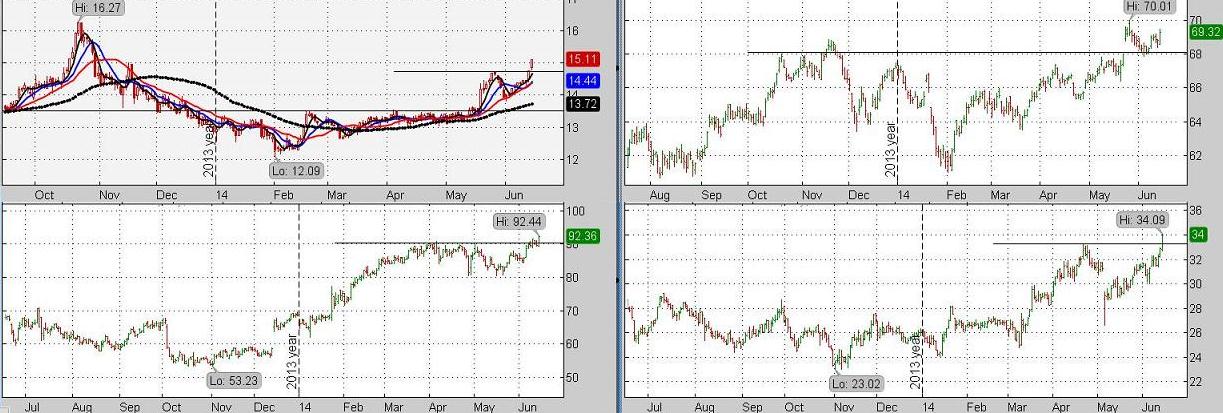
We scan thousands of stocks to find breakouts, price reversals, stocks that are surging in price, and stocks that have started a new up-trend. Stocks that have just had a breakout have overcome overhead resistance. The timing is right because the breakout surge is fresh and enthusiasm is high. That enthusiasm may last a few days, giving the Investor an opportunity monitor the stock to see if there is support at the breakout price. On a breakout, experienced investors look for follow-through momentum or a price surge as even more buyers find the stock.
Price reversals are part of the search because they also attract attention. However, for this scan we are not particularly interested in counter-trend price spikes that may not really mark the beginning of a new trend. Instead of a “V-shaped” price reversal, we are interested more in the turn of a short-term moving average. A “U-shaped” price reversal gives more convincing evidence that we are seeing the beginning of a new positive trend.
Price surges are included in the search because stocks that are surging in price also draw additional attention, compounding the surge. A price surge occurs when there is a sudden surge of new buyers of the stock. New buying interest may be the result of higher earnings expectations, a new product, a favorable FDA ruling, a new cure or discovery, or some other exciting news. A sudden increase or surge in investor enthusiasm for the prospects of a company is probably what’s driving the price higher. Buying a stock that has recently had a price or momentum surge is a favored tactic among traders because a surging stock enables them to make a larger gain in less time. The positive momentum of the price surge also is commonly associated with a short-term reduction in risk.
A subroutine of this scanner’s breakout algorithm looks for yet another type of pattern. It requires that before the “breakout” a stock must have been in a trading range with an upper and lower boundary. The algorithm will detect stocks that have a closing price that is above the highest closing price during the previous six market weeks or more. On the day of the breakout, volume must surge 20% or more above its average volume for the previous 10 days. That means it finds breakouts from a trading range as well as other types of breakout (use the “Breakouts” tab on the left side of your screen and scroll to the last three charts to see illustrations of trading range breakouts).
The image with this product description is just one of the patterns detected. Go to the “Breakouts” page (menu on left side of screen) to see 18 examples of the kind of stock behavior patterns detected by the algorithms used in this scan.
Return to the “Products & Prices” page


