$25.00
Click on the image to the left
to get a better view.
See description lower on this page.
Description
This subscription/service is intended for high-performance investors and traders who build “watch lists” and attempt to time their purchases so they coincide with the commencement of a significant advance. These investors and traders want access to frequent fresh lists of “setup” situations. They use our alerts to create lists of stocks that appear to be ready or nearly ready for a price surge. They then monitor the stocks on the “watch list” while they wait for a “trigger” event (buy signal). The “trigger” could be a higher high on increased volume in a certain context (a “bounce off of support, a penetrated resistance, a follow-through advance after a Bollinger band squeeze and upper band penetration, or some other event that suggests a significant move is under way).
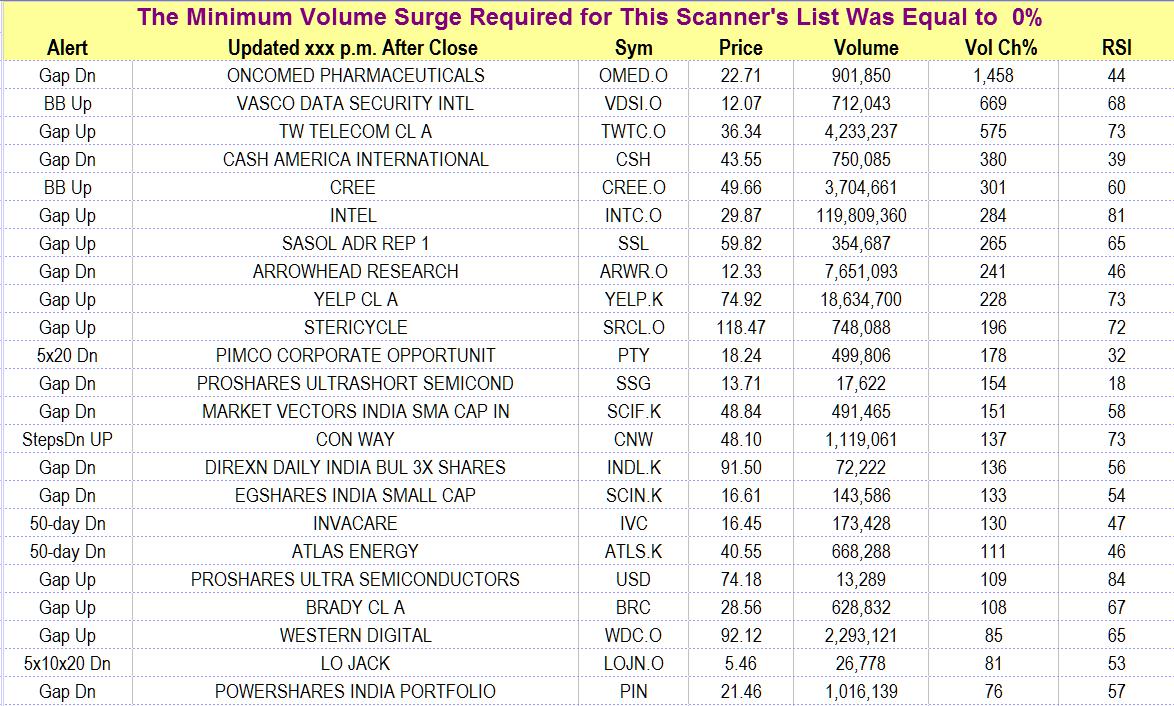
The image at the right is an example of what a list looks like, except that the image has been reduced in size to show more of the list. We put a label identifying the alert that was triggered to the left of each stock and then sort the list by the magnitude of the surge in volume. At one time we sorted by the type of alert (as pictured in the above sample). We have changed that. Now the stocks are ranked according to the magnitude of the surge in volume occurring the day the alert is triggered. We do that because, as a general rule, the greater the volume surge, the more reliable the alert. Accordingly, those with the biggest volume surge are ranked higher regardless of the kind of alert that has been triggered. The list in the image was generated on a quiet day when there were very few alerts and more down alerts than up alerts. Nevertheless, the large database enabled us to identify a number of stocks giving a bullish alert. We also show the price, the percentage change in volume, and the RSI for each stock on the day of the alert.
For subscribers, we compile lists of stocks that satisfy each of the alert conditions described in the “Explanations” section of the “Stock Alerts” page. There are actually 11 alerts generated by these six systems. They include six “up” alerts and five “down” alerts. The descriptions are too lengthy to place here. The following link will take you to a new page with descriptions. When you close the page, you will return here. To review the list of alerts, go to Alerts in StockAlerts
This publication does not provide the information on fundamentals that you will find in The Valuator. On the other hand, it scans more stocks. The Valuator reports on fundamental and technical information for a list of about 500 selected stocks that we consider worth tracking. StockAlerts scans thousands of stocks to determine if certain “setups” have occurred (the database has over 8,000 stocks).
A “setup” is a stock pattern of price and/or volume behavior that is believed by many traders to precede a significant upward or downward move (with a relatively high level of reliability). For example, a period of relatively low volatility often precedes a price surge. That means Bollinger bands will often have narrow separation before a surge. However, the probable direction of the surge is not always clear in advance. StockAlerts will notify subscribers if the upper Bollinger band is penetrated after such a squeeze because that would suggest a move to the upside is in the offing. It also gives alerts for stocks penetrating the lower Bollinger band after a Bollinger Band squeeze. The Bollinger Band alert system is just one of six alert systems monitored.
Subscribers can access the lists generated by the six alert systems in the “Subscribers Only” section of this website. Just one timely entry point can pay for a year’s subscription fee many times over.
The number of stocks in each of the lists in StockAlerts will vary. At any given time, there may be many stocks or none that have triggered a particular alert.
