Stock Alerts
Daily Stock Alerts, Stock Setups, and Signals

We have a variety of scanners/filters on this site. List of Scanners/Filters
Setup alerts, including triple moving average and Donchian crossover alerts, Bollinger Band squeeze alerts, breakout alerts, gap alerts, signals, surge alerts, and other watch list candidates are included in this list. This scanner will, for example, generate an alert when stocks have had a Bollinger Band squeeze and a band penetration after the squeeze. Other sites may list stocks with a Bollinger Band penetration, but a band penetration without the preliminary squeeze is of little use. It is the squeeze that gives the band penetration meaning (see the explanation below). Our scan results are much more significant than what you find on other sites. For example, a gap in price without a surge in volume is not nearly as meaningful as a gap with a surge in volume our gap alerts occur when there is a gap with a surge in volume. .
This page describes the use of alerts and signals in a disciplined strategy.
Alerts/Signals Are at 4 Other Locations on This Website.
(Check them out: different pages use different screens – R.C. Allen, Surges, etc.)
Use “Directory” to see what’s where on the site. Directory
Below, there is information about alerts and alert systems, Bollinger band squeezes and band penetrations, gaps with volume surges, Donchian signals, illustrations of stock “setups,” and information about our StockAlerts subscription.
Top Portfolio Performance Requires A Good Alert System
In order to have a list of stocks available so you can quickly replace stocks that have just been sold, it is necessary to have a “watch list.” To create a watch list consisting of stocks that are about to surge you must focus on “setups.” Develop strategies, disciplines, and systems that will enable you to find “setup” situations quickly and regularly. You should have an alert “system” that will flash alerts for turnaround setups, alerts for price setups that signal a pending breakout, alerts on setups that signal a new trend, alerts for setups that indicate a stock is likely to break down soon, and alerts when moving average setups occur (as when they signal momentum alignments that suggest the beginning of a new trend). The Donchian systems and the R.C. Allen triple moving average crossover system (and its variants) are such systems.
You should have a heavy-duty real strength screener not just the RSI (see Strongest Stocks and The Valuator).
Use An Alert System To Build Your Watch List
The most successful traders and investors do not want to wait 6 months to find out whether a stock will perform. They plan their purchases so that they will know within days or at most a few weeks if their decision to buy was right or wrong. They do this by monitoring a variety of alert screens. An alert screen tells you that a specific “setup” has occurred that usually culminates in a significant move. Once the conditions of the alert have been satisfied, the trader puts a stock on his “watch list.” He then waits for the alert to become validated by the commencement of the move or a “trigger event.”
An example of a validated alert would be if a stock is placed on the “watch list” because an alert signaled that the stock has declined to its rapidly rising 50-day moving average. As the stock nears its rising 50-day moving average, you would put it on your “watch list.” The confirmation occurs if the stock reverses its downward direction after touching its rising 50-day moving average (institutional investors tend to be buyers at such times). The alert announces “Here is one to watch!” The “trigger event” says “it’s time to act!” The trader uses alerts because time is money. To achieve maximum returns on his money, the trader attempts to keep his portfolio fully invested in profitable positions. Any time a portfolio has a non-performing position, that portion of the portfolio exerts a drag on the result of all the positive work being done by the performing positions. Why buy a stock just because it has a “good story” and then wait for 6 months for it to make any progress, when a simple alert system can really direct you to stocks that are about to move now. By using alerts to create “watch lists,” you can dramatically cut your wait time for performance. Traders at Stock Disciplines generally wait no more than 2 weeks for the expected move. If it doesn’t occur, they know that the setup failed, and that it is time to look elsewhere. They have to have a very good reason to keep holding.
Let’s assume a trader (or investor) likes to maintain 10 positions in his portfolio. Each position is a “slot” or “basket.” Every time a stock is purchased, a slot or basket is filled. If any basket has no position in it, that basket is non-performing. If our trader averages 7 positions over the year, then 3 empty baskets have dragged down the performance of the other 7. Instead of averaging 40% for the year (assuming each position gained 40%), the portfolio will gain only 28% (assuming little or no interest for the empty slots). If the trader has an alert system that tracks several thousand stocks while monitoring a variety of alert “setup” conditions, then when the portfolio sells a position, it won’t take long for the alert system to find another “setup.” The alert system also increases the odds that the trader will not have to wait long for the new stock to perform. The alert system can notify the trader if either a “buy” or a “sell” setup is emerging. If the trader has sold a position but the alert system cannot find a replacement buy candidate among several thousand stocks while using a variety of alert strategies, then the market is probably not trending but simply moving sideways or declining. An alert system therefore has a “built-in” discipline that keeps the trader from filling empty portfolio slots with non-performing stocks. If the alert system cannot find any stocks that are setting up for a significant move, then why buy anything?
Why do traders at Stock Disciplines consider StockAlerts reports to be superior to reports found on most websites? To begin with, StockAlerts is based on a pre-screened stock universe. That screening eliminated many (but not all) “junk” stocks. In addition, our search algorithms are more complex, requiring more complete or better “setups.” For example, some websites might find stocks that have penetrated a Bollinger band but StockAlerts finds stocks that penetrate a Bollinger band AFTER a Bollinger band squeeze (a period of low volatility). That factor alone makes a very big difference in the quality of the signal. Let’s say you are looking for stocks that satisfy the 4-week rule originated by Richard Donchian. Some scanners will find stocks that close above their highest price for the last 20 days. That means any stock making new highs can satisfy the filter. Is that what you really want from the filter? That’s possible, but there is something better. What you really want are stocks that have broken out of a 4-week consolidation pattern. The sideways pattern is important because it represents consolidation. That is, the old shareholders are nervous about the stock and are bailing out while new shareholders that are believers in the stock are replacing them. You want stocks that have been going sideways but that are now resuming their upward climb. Our Bollinger Band Squeeze alert delivers that. A squeeze results when a stock goes essentially sideways (during this consolidation time volatility is usually low because there is a relative balance between buyers and sellers). Our alert system is designed to signal an upper band penetration only AFTER a squeeze. This also satisfies the purpose of Donchian’s channel breakout rule. We know of no other stock filter that can do that. Our algorithm does not specify that the stock has to consolidate for exactly 4-weeks. However, it does require some “consolidation” or a “quiet” period before the breakout.
StockAlerts is one of the tools that our company members use to find stocks that are about to move. It filters a database of over 8,000 stocks and then checks to find those that trigger a variety of alert systems. We create lists of stocks that have triggered any of six important alert systems. We believe the lists provided are worth far more than the price of a subscription.
The lists are available in the password-protected “Subscribers” section of this site. We believe this can be an extremely valuable resource for those who want to maintain a “watch list” that is regularly updated with a fresh supply of stocks that appear to be getting ready for action soon. What follows is a description of StockAlerts.
Stock Alerts
First, let’s consider what an alert is. Suppose that a stock has been in a trading range for 6 months, ranging between $22 and $27. What we would want is an alert system that will notify us when conditions suggest the probable penetration of the $27 barrier. For example, let’s assume that our scanning computer has already identified the stock as being in a trading range. What are some of the other conditions that we might require before an alert is generated? We might want the stock to have diminishing volume when its price has been in decline and increasing volume when the stock has been rising. We may want the stock to achieve a new 4-week high or give some other sign that it is breaking out of its trading range. If we do, then we also want the volume to pick up dramatically as the stock penetrates the upper boundary of its trading range. We want the alert to say “watch this one, it may be about to break through the overhead resistance” or “check this one out, it has just broken through the overhead resistance.” The alert should not say, “buy this!” Alerts are not “buy” or “sell” signals. After getting an alert, the trader might then wait to see what happens next. Does the stock immediately collapse back into its trading range? Does the upper boundary of its trading range ($27 in the example above) act as support after the breakout? The point is that the alert merely prompts the trader to place the stock on the watch list so that a quick response can be made if the “trigger event” occurs (if the stock succeeds in pushing through the resistance at $27, tests support there, and then begins to climb). Just because the stock breaks through the resistance at $27, there is no guarantee that the stock will keep rising. For some traders, though, the breakout is enough. For them, early entry is worth the risk of a breakout failure. That is, the “breakout” may be a “fake-out.” That’s why some traders require the satisfaction of additional conditions. The alert might also be designed to stay mute until the stock has remained above the resistance a certain number of days. Even so, the alert cannot guarantee a good result. However, waiting for the alert does increase the probability that the trade will have a successful outcome. A well-designed alert system also minimizes the “down time” for the “slots” in a portfolio when they become vacant.
All the stocks in the StockAlerts database are regularly scanned to determine if certain strategy “setups” have occurred. A “setup” is a stock pattern of price and/or volume behavior that often precedes a significant upward or downward move (with a relatively high level of reliability). If our scanning system “thinks” a stock may be completing one of these patterns, it will generate an alert and identify the suspected pattern. The StockAlerts output makes it much easier to find the stocks that disciplined strategies covet.
Once again, empty slots in a portfolio lessen the impact on the portfolio of the gains achieved by the advancing positions. Therefore, high performance systems and disciplines tend to keep all slots full–and making money. The level of performance achieved by your strategies by the end of the year will be determined by the percentage of time the portfolio is fully invested in accordance with your high-performance strategies. The most effective traders develop systems that keep their strategies invested by quickly filling empty slots with rising stocks (or declining stocks for short-sellers). To this end, many successful traders maintain a “watch list” of up to about 300 stocks that they constantly scan to see if any are ready for inclusion in the portfolio.
StockAlerts is intended to be a helpful tool in the development of the “watch list.” It scans for stocks that have completed or nearly completed an attractive “setup.” Thus, the stocks highlighted tend to be more timely than those of most lists. Once a stock generates an alert, it should not take long to learn if the money is well-placed. This much shorter “wait time” is extremely important, because the saying “time is money” is particularly true for traders. If the stock does not follow through with the expected advance within two weeks, the investor knows that the “setup” failed, and that there is no reason to continue holding the stock. It can be sold with little or no loss and replaced with another stock in a “setup” configuration. Without this advantage, a person might be “involved” with a stock for months without a clear indication about its “intentions.” A regular review of the stocks that generate alerts in StockAlerts should be a very useful discipline for traders in their efforts to maintain a list of stocks that are ready for action at any given time. Keeping and maintaining a good “watch list” is one of the more important stock trading disciplines.
The signals generated in StockAlerts are not recommendations to buy or sell. We simply report the output of various search algorithms. The reader will have to evaluate the signals generated with regard to their context (overall chart pattern, news related to the company, etc.). Even if one of our reports indicates that an alert has just been triggered, a careful analysis of the chart may reveal significant resistance just above the current price. Therefore, caution is in order. Never act on an alert without evaluating its context. The alert system cannot detect the difference between a great setup and something that looks good but is actually a dangerous “booby trap.” If you decide the stock is not a “booby trap” and that there is no strong resistance that must be overcome, then it can be considered for inclusion in a “watch list” and monitored to see if an appropriate follow-through buy signal occurs. Our system currently generates the information and alerts listed in the following “EXPLANATIONS” section. Only the “UP” alerts are defined below, but our scanning system generates both “UP” and “DN” alerts. The “DN” alert indicates the existence of conditions opposite to those that cause an “UP” alert.
The following table resembles the reports subscribers get with a StockAlerts subscription. Below the table, there is a description of the alerts provided and charts to demonstrate what those alerts might look like. Those charts do not represent stocks listed in the following table. Subscribers get tables resembling (in general layout) the following table, but it will be up to subscribers to enter the symbols in a charting program or website and evaluate whether or not the stocks should be bought, sold, included in a watch list, or ignored.
Subscriber lists include up to 100 alerts (ranked according to the surge in volume that accompanies each alert). We start with a database of about 8000 stocks. These are filtered, and then scanned by our algorithm to detect various “alert configurations.” The following list is an out-of-date example and should not be considered current. The market had been struggling for over a month and in a fairly steep decline for nearly a week when the list was generated. The purpose of the example is to show the layout of our reports, not to give current purchase candidates. Also, the list was artificially modified to show a variety of alert types in a small space for illustrative purposes. the “Gap” alerts are far more common than illustrated here.
Note: the following table was created several years ago.
| The Minimum Volume Surge Required for This Scanner’s List Was Equal to 0 | ||||||
| Alert | Updated [Day] p.m. After Close mm/dd/yy | Sym | Price | Av. $/Day | Vol Ch% | RSI |
| StepsDn UP | BROWN FORMAN CL A | BFa | 109.53 | 3,854,855 | 1,924 | 66.4 |
| 5×20 Up | HARVARD BIOSCIENCE | HBIO | 5.84 | 1,119,468 | 1,580 | 65.7 |
| BB Up | DYNAMIC MATERIALS | BOOM | 11.57 | 1,397,585 | 1,414 | 54.5 |
| 5x10x20 Up | TOWNSQUARE MEDIA CL A | TSQ | 13.85 | 522,172 | 1,236 | 61.1 |
| 5x10x20 Dn | VERSARTIS | VSAR | 15.92 | 3,414,979 | 1,092 | 42.9 |
| StepsDn UP | HERITAGE CRYSTAL CLEAN | HCCI | 15.24 | 830,357 | 1,080 | 57.5 |
| 5×20 Dn | GRAPHIC PACKAGING HOLDING | GPK | 13.74 | 47,409,605 | 891 | 39.0 |
| 50-day Up | WEX | WEX | 116.25 | 34,131,468 | 885 | 54.4 |
| 50-day Up | CORELOGIC | CLGX | 40.71 | 31,328,377 | 867 | 70.0 |
| 5x10x20 Up | MYRIAD GENETICS | MYGN | 34.14 | 25,899,933 | 854 | 53.9 |
| 5x10x20 Up | HRG GROUP | HRG | 13.22 | 10,699,012 | 775 | 56.6 |
| Gap Dn | MARKET VECTORS SEMICONDUCTOR | SMH | 55.91 | 186,703,631 | 752 | 38.5 |
| 5x10x20 Up | CUTERA | CUTR | 15.63 | 1,620,147 | 744 | 65.2 |
| 5×20 Up | VECTRUS | VEC | 25.21 | 2,430,870 | 720 | 51.4 |
| StepsDn UP | RADIANT LOGISTICS | RLGT.K | 7.2 | 1,943,883 | 715 | 58.1 |
| BB Up | FIFTH STREET ASSET MNGMNT CL A | FSAM | 10.42 | 975,718 | 653 | 56.2 |
| BB Dn | CLICKSOFTWARE TECHNOLOGIES | CKSW | 12.53 | 6,593,660 | 646 | 63.1 |
| 5x10x20 Up | NUVEEN DIVIDEND ADVANTAGE MUNI | NZF | 13.5 | 635,519 | 633 | 42.6 |
| 50-day Dn | XENOPORT | XNPT | 6.11 | 2,878,043 | 625 | 41.3 |
| 5x10x20 Up | CORVEL | CRVL | 32.75 | 1,379,274 | 615 | 45.6 |
| 5x10x20 Dn | GREIF CL A | GEF | 37.15 | 10,331,585 | 590 | 33.8 |
| StepsDn UP | ULTRAGENYX PHARMACEUTICAL | RARE | 103.16 | 47,896,691 | 584 | 72.7 |
| 50-day Dn | NEWPORT | NEWP | 19.22 | 3,390,068 | 521 | 50.1 |
| 5x10x20 Up | MATERION | MTRN | 38.91 | 3,881,359 | 505 | 61.0 |
| 50-day Dn | ENDURANCE INTERNATNL GRP HLDNGS | EIGI | 20.4 | 31,778,918 | 499 | 45.0 |
| 5×20 Dn | K2M GROUP HOLDINGS | KTWO | 23.83 | 3,682,090 | 497 | 43.8 |
| 5x10x20 Dn | RING ENERGY | REI | 11.27 | 1,341,763 | 496 | 39.5 |
| StepsDn UP | QAD CL A | QADA | 27.43 | 1,987,999 | 491 | 60.7 |
| 5x10x20 Up | ANDERSONS | ANDE | 41.3 | 10,774,688 | 481 | 42.6 |
| Gap Dn | KRANESHARES CSI CHINA INTERNET | KWEB | 40.97 | 4,818,983 | 469 | 41.0 |
| Gap Dn | GUGGENHEIM CHINA REAL ESTATE | TAO | 23.27 | 728,820 | 452 | 38.6 |
| 5x10x20 Dn | COUPONS.COM | COUP | 11.8 | 6,502,587 | 450 | 41.1 |
| 5×20 Dn | MOELIS CL A | MC | 28.81 | 5,832,100 | 446 | 38.7 |
| 5×20 Dn | OPOWER | OPWR | 11.57 | 2,726,631 | 434 | 46.0 |
| Gap Dn | SPDR S&P CHINA | GXC | 89.64 | 18,387,390 | 402 | 36.1 |
| 5x10x20 Up | CHENIERE ENERGY PARTNERS | CQP | 32.36 | 6,048,881 | 395 | 48.8 |
| BB Dn | ULTRA PETROLEUM | UPL | 13.18 | 29,835,987 | 390 | 31.5 |
| BB Up | NUVERRA ENVIRONMENTAL SOLUTIONS | NES | 6.19 | 2,368,438 | 377 | 72.3 |
| 5×20 Up | FIVE STAR QUALITY CARE | FVE | 5.06 | 1,079,710 | 368 | 66.6 |
| BB Dn | BOINGO WIRELESS | WIFI | 8.67 | 3,026,534 | 367 | 41.2 |
| StepsDn UP | NIELSEN | NLSN | 46.22 | 133,775,921 | 366 | 62.1 |
| 5×20 Dn | USA TRUCK | USAK | 21.62 | 1,933,918 | 365 | 34.9 |
| 5x10x20 Dn | IGNYTA | RXDX | 15.17 | 10,230,645 | 362 | 51.3 |
| Gap Dn | YANZHOU COAL ADR REP 10 | YZC | 8.04 | 838,729 | 362 | 35.0 |
| BB Dn | CHEETAH MOBILE ADR REP 10 CL A | CMCM | 31.01 | 44,552,163 | 360 | 45.7 |
| BB Dn | ADTRAN | ADTN | 16.35 | 12,971,566 | 355 | 34.3 |
| 5×20 Dn | KARYOPHARM THERAPEUTICS | KPTI | 26.04 | 8,549,044 | 337 | 39.4 |
| BB Dn | OTONOMY | OTIC | 21.48 | 5,319,705 | 336 | 30.8 |
| BB Dn | MARCUS & MILLICHAP INC. | MMI | 44.55 | 8,511,189 | 335 | 41.1 |
| 5x10x20 Up | MORGANS HOTEL GROUP | MHGC | 6.85 | 659,365 | 335 | 52.2 |
| 50-day Dn | BERRY PLASTICS GROUP | BERY | 33.67 | 45,784,415 | 333 | 47.3 |
| 5x10x20 Up | COMPANIA CERVECERIAS ADR REP 2 | CCU | 21.6 | 2,747,050 | 332 | 44.3 |
| 50-day Dn | CHECKPOINT SYSTEM | CKP | 10.3 | 1,695,136 | 329 | 45.8 |
| 5x10x20 Up | BARCLAYS GLOBAL HIGH YIELD | FIGY | 123.241 | 936,160 | 328 | 46.1 |
| 5×20 Up | BANKFINANCIAL | BFIN | 11.96 | 876,647 | 328 | 51.4 |
| 5×20 Up | SIERRA BANCORP | BSRR | 17.38 | 501,581 | 325 | 65.0 |
| 5×20 Dn | KRONOS WORLDWIDE | KRO | 11.28 | 2,938,114 | 312 | 31.5 |
| 5x10x20 Up | TRIMBLE NAVIGATION | TRMB | 23.48 | 38,628,703 | 310 | 46.7 |
| BB Dn | HOUGHTON MIFFLIN HARCOURT | HMHC | 25.77 | 32,786,616 | 302 | 47.5 |
| StepsDn UP | SURGICAL CARE AFFILIATES | SCAI | 39.92 | 7,201,400 | 302 | 59.2 |
| BB Dn | CANADIAN SOLAR | CSIQ | 29.75 | 74,936,062 | 299 | 33.9 |
| BB Dn | AVAGO TECHNOLOGIES | AVGO | 135.15 | 477,920,133 | 297 | 43.5 |
| 5×20 Up | AMER VANGUARD | AVD | 14.34 | 3,383,664 | 296 | 57.4 |
| Gap Up | BARCLAYS BK IPATH BLOOM GRAINS | JJG | 36.28 | 2,199,044 | 295 | 69.4 |
| 5×20 Dn | CONTROL4 | CTRL | 9.08 | 2,683,693 | 292 | 37.7 |
| 50-day Dn | AKORN | AKRX | 43.51 | 90,601,911 | 292 | 39.5 |
| StepsDn UP | STEINER LEISURE | STNR | 56.15 | 3,935,691 | 292 | 67.9 |
| Gap Dn | MARKET VECTORS CHINA AMC CL A | PEK | 54.26 | 7,212,877 | 287 | 30.7 |
| 5x10x20 Dn | CITI TRENDS | CTRN | 24.96 | 3,533,238 | 286 | 45.3 |
| Gap Up | RESTORATION HARDWARE HOLDINGS | RH | 99.35 | 69,160,658 | 282 | 70.2 |
| Gap Dn | MICRON TECHNOLOGY | MU | 19.66 | 485,252,995 | 279 | 13.4 |
| Gap Dn | SYNNEX | SNX | 74.88 | 14,318,616 | 275 | 28.3 |
| 5×20 Dn | ONCOMED PHARMACEUTICALS | OMED | 23.13 | 3,271,436 | 271 | 39.0 |
| 5x10x20 Up | UCP CL A | UCP | 8.01 | 603,191 | 270 | 54.4 |
| Gap Dn | YOUKU TUDOU ADR REP 18 CL A | YOKU | 24.61 | 113,979,455 | 268 | 38.7 |
| StepsDn UP | KAMAN | KAMN | 42.95 | 3,863,825 | 266 | 54.2 |
| 5x10x20 Dn | FEDERATED INVESTORS CL B | FII | 34.4 | 15,696,521 | 266 | 46.7 |
| StepsDn UP | BROWN FORMAN CL B | BFb | 100.93 | 50,011,937 | 265 | 64.7 |
| Gap Dn | KRANESHARES BSRA MSCI CHNA CL A | KBA | 55.66 | 1,490,620 | 255 | 31.5 |
| StepsDn UP | INTREXON | XON | 48.28 | 56,449,410 | 254 | 60.4 |
| 5x10x20 Up | ALERE | ALR | 52.27 | 19,729,264 | 254 | 60.2 |
| Gap Dn | INSIGHT ENTERPRISES | NSIT | 30.64 | 7,779,479 | 252 | 45.2 |
| 5x10x20 Dn | TEXAS PACIFIC LAND | TPL | 150 | 1,499,720 | 248 | 47.3 |
| 5x10x20 Dn | STAR GAS PARTNER | SGU | 8.92 | 1,003,965 | 245 | 59.9 |
| 50-day Up | LEUCADIA | LUK | 24.57 | 29,356,690 | 244 | 55.7 |
| 5x10x20 Dn | T2 BIOSYSTEMS | TTOO | 16.86 | 1,655,322 | 244 | 40.2 |
| 50-day Dn | J G WENTWORTH CL A | JGW | 9.61 | 1,095,518 | 243 | 41.6 |
| 5×20 Dn | SEMTECH | SMTC | 21.1 | 13,924,152 | 243 | 37.5 |
| BB Dn | EXAR | EXAR | 10.18 | 2,211,069 | 241 | 37.2 |
| 5×20 Up | LUXOFT HOLDING CL A | LXFT.K | 59.6 | 13,825,393 | 237 | 69.0 |
| Gap Dn | DIREXION SEMICONDUCTOR BULL 3X | SOXL | 33.95 | 15,997,847 | 237 | 36.5 |
| BB Dn | RELYPSA | RLYP | 32.61 | 13,924,221 | 231 | 39.0 |
| BB Dn | FIFTH STREET SENIOR FLOATING RAT | FSFR | 9.74 | 1,443,093 | 231 | 30.5 |
| 50-day Up | LOUISIANA PACIFIC | LPX | 17.46 | 43,679,948 | 230 | 50.1 |
| Gap Dn | DET X TRK HRVT CSI 500 CHN CL A | ASHS | 54.6 | 8,326,703 | 227 | 31.2 |
| 5×20 Dn | HANNON ARMSTRONG SUST INFR CAP | HASI | 19.78 | 3,933,377 | 227 | 46.8 |
| 5×20 Dn | ANALOG DEVICES | ADI | 65.8 | 152,577,813 | 217 | 45.8 |
| 5x10x20 Up | MEXICO | MXF | 21.5 | 563,028 | 217 | 40.7 |
| 50-day Dn | TRIANGLE PETROLEUM | TPLM | 5.21 | 6,436,504 | 217 | 49.9 |
| 5x10x20 Up | JONES LANG LASALLE | JLL | 173.92 | 61,985,539 | 211 | 58.5 |
| Gap Up | CEPHEID | CPHD | 60.69 | 30,475,231 | 208 | 65.7 |
| StepsDn UP | NACCO CL A | NC | 62.37 | 1,545,706 | 207 | 65.5 |
| StepsDn UP | ENSIGN GROUP | ENSG | 52.07 | 7,006,877 | 205 | 64.2 |
| 50-day Dn | FIRST POTOMAC REALTY | FPO | 10.52 | 2,793,962 | 205 | 49.7 |
| Gap Dn | DAILY JOURNAL | DJCO | 200.61 | 1,332,897 | 203 | 41.5 |
| BB Dn | NU SKIN ENTERPRISES CL A | NUS | 48.5 | 41,245,009 | 199 | 29.3 |
| 50-day Dn | ERIE INDEMNITY CL A | ERIE | 81.62 | 2,583,387 | 199 | 46.3 |
| StepsDn UP | SEQUENTIAL BRANDS GROUP | SQBG | 15.58 | 2,630,910 | 197 | 61.1 |
| 50-day Dn | CHRLS RIVER LABS | CRL | 71.69 | 29,257,170 | 196 | 41.5 |
| 5x10x20 Dn | ALCENTRA CAPITAL | ABDC | 13.49 | 604,207 | 193 | 36.5 |
| 5x10x20 Dn | SONIC AUTOMOTIVE CL A | SAH | 24.46 | 7,644,524 | 192 | 55.6 |
| Gap Up | DIREXION SEMICONDUCTOR BEAR 3X | SOXS | 44.05 | 3,621,566 | 187 | 61.4 |
| StepsDn UP | ISHARES MSCI NETHERLANDS | EWN | 26.79 | 8,238,572 | 186 | 53.4 |
| BB Dn | ZS PHARMA | ZSPH | 51.49 | 19,834,310 | 186 | 41.1 |
| 5×20 Dn | TECHTARGET | TTGT | 9.01 | 936,378 | 186 | 36.7 |
| 5×20 Up | NORTEK | NTK | 83.58 | 1,500,296 | 184 | 49.9 |
| 5x10x20 Dn | EXELON CORP | EXCU | 46.69 | 6,810,172 | 183 | 35.5 |
| 5×20 Dn | DANA HOLDING | DAN | 21.34 | 32,605,217 | 183 | 42.1 |
| 5x10x20 Dn | TERRENO REALTY | TRNO | 20.02 | 2,720,261 | 179 | 36.8 |
| 5x10x20 Up | STONEGATE BANK | SGBK | 29.87 | 1,258,297 | 178 | 51.1 |
| BB Dn | TRIUMPH GROUP | TGI | 66.56 | 34,567,796 | 174 | 45.5 |
| 5×20 Dn | GETTY REALTY | GTY | 16.8 | 1,383,004 | 174 | 41.6 |
| 5x10x20 Up | TERRAFORM POWER CL A | TERP | 39.15 | 41,808,451 | 171 | 54.4 |
| 5×20 Up | AMERIS BANCORP | ABCB | 25.96 | 2,903,452 | 170 | 54.2 |
| 5x10x20 Dn | LAREDO PETROLEUM | LPI | 13.08 | 44,187,676 | 170 | 38.5 |
| Gap Up | FOOT LOCKER | FL | 67.31 | 122,157,267 | 169 | 74.5 |
| 50-day Dn | RUCKUS WIRELESS | RKUS | 10.59 | 13,874,941 | 165 | 38.9 |
| Gap Dn | HUANENG POWR INT ADR REP 40 CL N | HNP | 53.34 | 3,695,949 | 165 | 47.2 |
| 5x10x20 Up | GENMARK DIAGNOSTICS | GNMK | 9.49 | 2,014,622 | 163 | 47.9 |
| Gap Up | CHART INDUSTRIES | GTLS | 37.01 | 20,236,401 | 163 | 63.7 |
| Gap Dn | CHINA SOUTH AIRL ADR REP 50 CL H | ZNH | 57.63 | 6,291,948 | 159 | 57.3 |
| StepsDn UP | HOLOGIC | HOLX | 38.25 | 71,766,103 | 159 | 69.8 |
| Gap Dn | GUGGENHEIM CHINA SMALL CAP | HAO | 31.93 | 7,564,356 | 158 | 37.8 |
| 5x10x20 Dn | MARINEMAX | HZO | 23.07 | 7,232,575 | 157 | 39.9 |
| Gap Dn | INTEL | INTC | 31.02 | 846,575,753 | 157 | 37.3 |
| StepsDn UP | PLANTRONICS | PLT | 57.14 | 20,189,554 | 150 | 54.1 |
| 5x10x20 Dn | CARBO CERAMICS | CRR | 43.13 | 28,404,927 | 150 | 47.9 |
| StepsDn UP | OSIRIS THERAPEUTICS | OSIR | 19.38 | 3,027,116 | 150 | 57.2 |
| Gap Dn | ARM HOLDINGS ADR REP 3 | ARMH | 50.99 | 71,263,993 | 150 | 42.2 |
| StepsDn UP | ESSENT GROUP | ESNT | 27.66 | 16,528,834 | 145 | 70.5 |
| 5x10x20 Up | VF | VFC | 70.78 | 129,448,170 | 144 | 52.4 |
| BB Dn | WINDSTREAM HOLDINGS | WIN | 6.64 | 51,029,336 | 142 | 26.3 |
| 5×20 Dn | INGRAM MICRO CL A | IM | 26.01 | 24,246,943 | 141 | 40.0 |
| Gap Dn | AMERICAN CAP MORTGAGE INVST | MTGE | 16.27 | 7,803,953 | 141 | 22.8 |
| StepsDn UP | BOYD GAMING | BYD | 15.34 | 14,766,429 | 140 | 62.8 |
| StepsDn UP | LAZARD CL A | LAZ | 57.96 | 40,610,539 | 140 | 59.5 |
| 5x10x20 Dn | STONERIDGE | SRI | 12.25 | 733,842 | 140 | 47.7 |
| 5x10x20 Up | OWENS CORNIING | OC | 42.49 | 79,116,640 | 139 | 60.0 |
| 5x10x20 Up | BIOTELEMETRY | BEAT | 9.65 | 1,512,632 | 137 | 54.0 |
| StepsDn UP | GAMING AND LEISURE PROPERTIES RE | GLPI | 37.35 | 19,909,919 | 135 | 55.1 |
Notice: If you are a regular visitor, you may remember that we previously provided short but free lists taken from the bottom of the subscriber list. We no longer do that because stocks at the bottom of the list are often nowhere near as attractive as those higher on the list, and they therefore misrepresented the attractiveness of most of the stocks on the list. People reviewing those stocks might easily come to the conclusion that the rest of the stocks on the list are of similar attractiveness, and therefore think they are less desirable than they really are. Alternatively, we could have taken examples from higher up on the lists, but then there would be little incentive for people to subscribe if they could get free lists of currently attractive stocks.
Alerts in the StockAlerts System
Currently, the following alert signals are included in a StockAlerts subscription. The alert signals do not come with charts. Subscribers get lists similar to the above table. We list the alerts with the greatest surge in volume on the day of the alert. At any given time, there may not be any stocks generating a particular kind of alert. The signals generated are not recommendations to buy or sell. We simply report the output of various search algorithms. Even if an alert is triggered, a careful analysis of the chart may reveal that there is significant resistance just above the current price. If there is no strong resistance that must be overcome, stocks highlighted with an alert signal can be considered for inclusion in a “watch list” and monitored to see if an appropriate follow-through signal occurs.
The “UP” and “DN” alerts described below do not necessarily indicate that a stock has started to rise…yet. For example, an “UP” signal is an ALERT that a rise has begun or that the setup is nearly complete that could result in a rise soon. In other words, it is merely intended to be an attention grabber that draws your focus to a potential move and the probable direction of that move. Our system currently generates the following information and alerts. First we will show a chart, and then we will describe the alert.
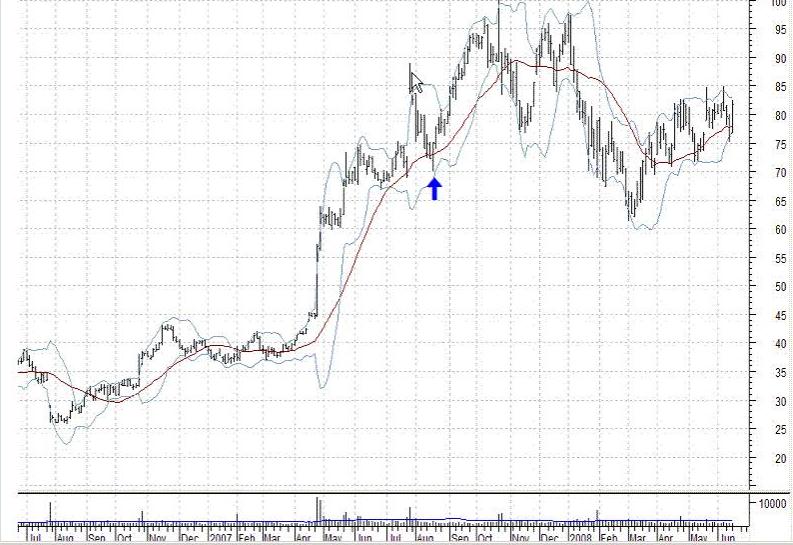
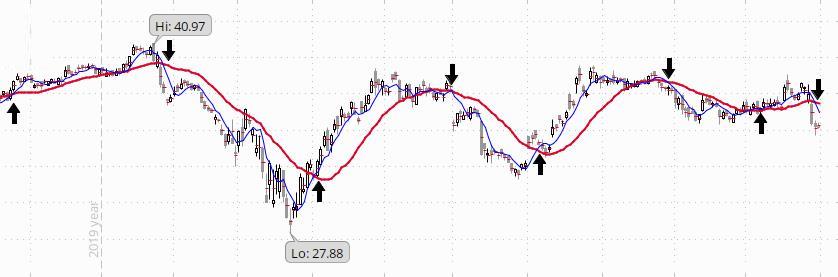
HIGH DN & UP System. If a stock is at a new recent high that the stock has not seen for at least 6 months (for example, see the white arrow in the chart) and then “stair-steps” its way down with each successive high lower than the previous high (as between the white and blue arrows), an alert is generated when a high occurs that is higher than the previous day’s high (the day after the day marked by the blue arrow). See if volume declined as the stock fell and increased on its rise. Declining volume on the price decline shows that it is probably only some profit taking rather than panic selling. The thinking behind this alert is that the stock has been strong and climbing to new highs. Then a wave of profit-taking set in that caused the stock to decline. After that, new buyers take positions and the stock resumes its climb as the demand for the stock once again overwhelms the supply provided by the sellers. Swing traders like to buy the day after the blue arrow (just above $75 in the chart) and hold for the surge in price that follows (up to about $95 in this case). Then they sell and look for other opportunities. The gains on such moves tend to be huge relative to the time invested. No “DN” alerts are generated.
GAP System (“Gap Up” and “Gap Dn” alerts). If a stock gaps up or makes an aggressive move so that its low for the day is at least .25 above the previous day’s high and if volume has a significant surge on that move, an “UP” alert is generated. The reverse conditions will trigger a “DN” alert. Expect a little pullback or consolidation shortly after such moves. In the above chart, a little consolidation takes place at $24 before the next surge. Also, be wary of overhead resistance nearby. That is, if there is overhead resistance just above the gap price, “Walk away.”
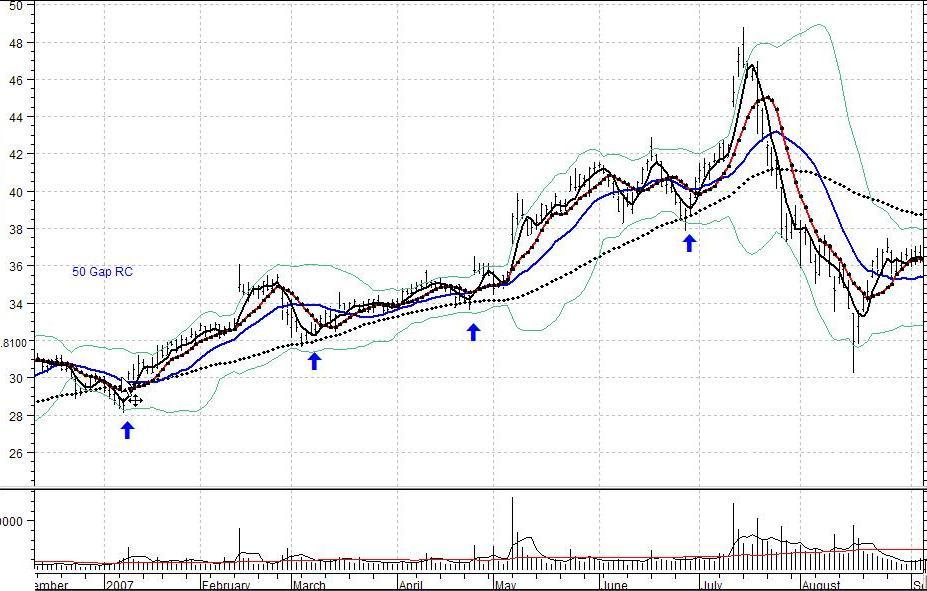
NEAR 50-Day moving average (dotted black line). If the stock’s 50-day SMA (simple moving average) is rising at a good rate (we measure the daily rate of change for the average) and the stock declines to a point that is or was near it within the last 3 days and is now rising (but was recently declining), an “UP” signal is generated (the “50-day Up” alert). Institutional investors tend to be buyers of a stock when it declines to its 50-day moving average. Therefore, the 50-day SMA will often offer support for a stock. Traders monitor such stocks to see if they begin to climb again when they touch or come close to this average. If the stock “jumps” on increasing volume, traders consider it a buy signal. If it does not rise after touching this average, the stock is not getting the expected support. This is a warning of possible trouble ahead. We have a page illustrating examples of this setup and what to avoid. This page should be visited regardless of the kind of setup you want to use because it illustrates what we mean by a “clean” setup. The key is to avoid setups that are not “Clean.” See clean setups
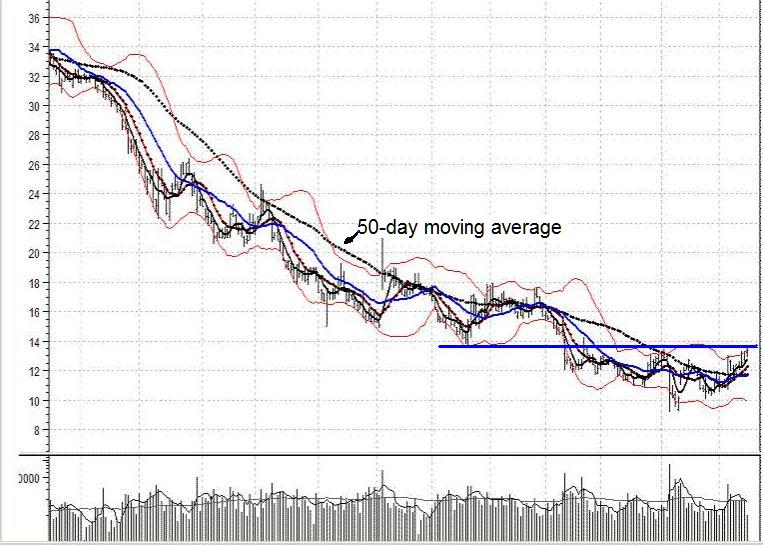
Near 50-day moving average (with average declining rapidly). This is a pattern attractive to short sellers. This setup is the reverse of the conditions in the previous chart, and these conditions will trigger a “DN” alert (this is the “50-Day Dn” alert). Here, the rapidly declining 50-day SMA (dotted black line) acts as resistance that turns the stock down each time it “tries” to rise. Our StockAlerts system flagged this stock with “Dn” alerts as it approached the 50-day moving average from below. Those alerts would have been very helpful to a short seller. However, once the stock has risen above the 50-day average, short sellers will not have much interest in the stock. [Additional comments: A beginning trader might look at the last days of this chart and conclude that it is a good time to buy. However, notice the resistance where we drew the blue line. When the stock was above the line, that line acted as support. Once the stock plunged below the line on heavy volume, the line became resistance. Therefore, we would reject the stock as a buy candidate. We would not be interested in this stock unless it managed to move above that line, preferably on a surge in volume. We might even wait for the stock to test the support of that line after it climbs above it. As it is, we think the highest probability scenario is for the stock to continue consolidating below that blue line a little longer. We would look for a pattern in which volume increases as the stock rises and declines as the stock falls. Then, a surge in price through that blue line on a surge in volume would be of interest to us. Notice in the above chart that the last rise of the stock was accompanied by a pattern of declining volume. That is a bearish indication, and not at all what should happen if the stock were about to break out above the resistance.]
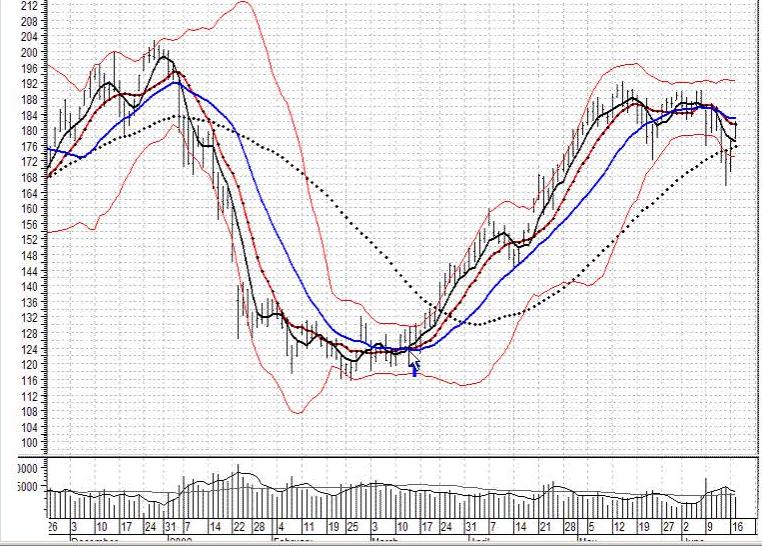
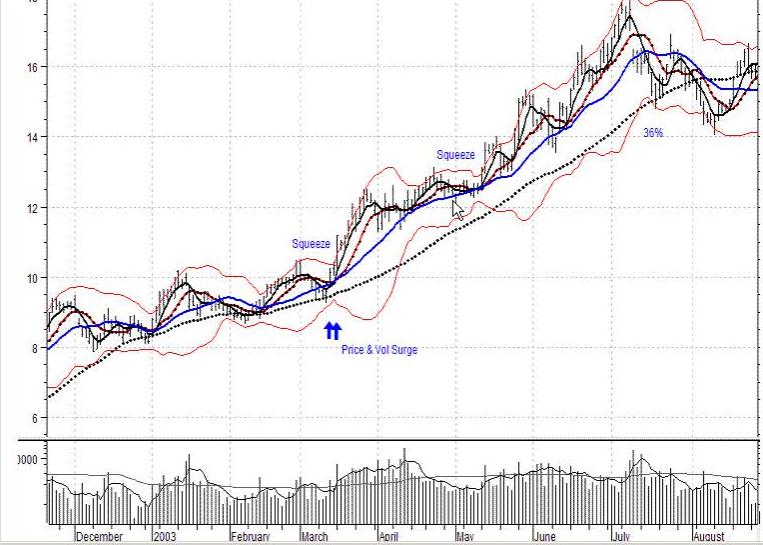
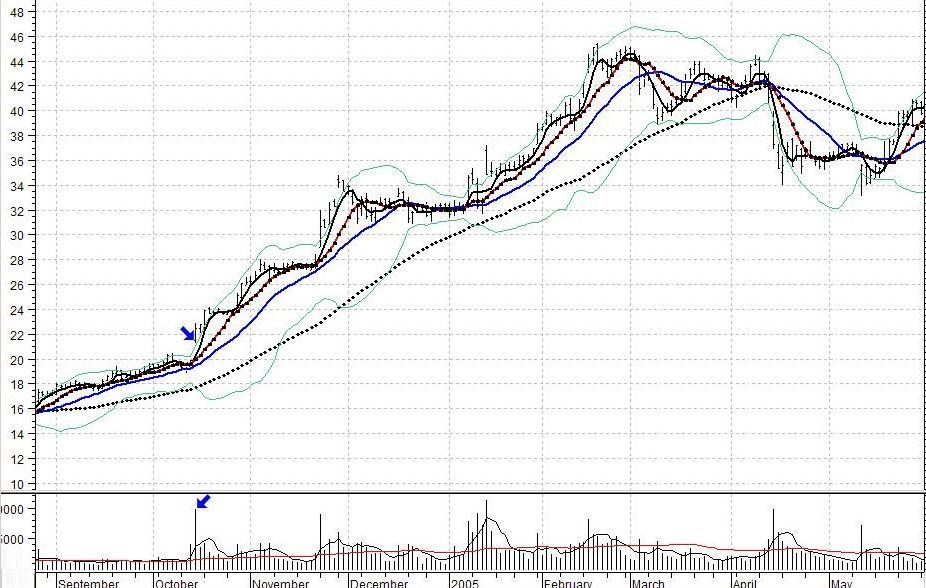
BOLLINGER BAND SQUEEZE (the “BB Up” and “BB Dn” alerts in the above sample table). The second of the two above charts shows squeezes of very short duration used as entry points in a rising trend. Note the rapidly rising 50-day moving average. A period of low volatility often precedes a strong move by a stock. The ensuing move may be a downward thrust or an upward thrust. Traders monitor stocks that have a Bollinger band squeeze (showing that the stock is experiencing a period of low volatility), waiting to see if the expected breakout is to the upside or downside. A “squeeze” is taking place when the upper and lower Bollinger bands are close to each other relative to their recent separation (in the above image, the Bollinger bands are the lavender lines that envelop the stock’s price pattern). After a squeeze, a thrust above the upper Bollinger band is seen as bullish and a thrust below the lower Bollinger band is seen as bearish. If the stock thrusts above the upper Bollinger band, the “UP” signal is generated. If the stock thrusts below the lower Bollinger band, the “DN” alert is generated. Because what constitutes a good Bollinger band squeeze is relatively subjective, we add the following notes.
1. Sometimes, our way of looking at a chart convinces us that a squeeze has not taken place even though it has. For example, we tend to view magnitude of separation by noting distance between bands along a line like the green dashed line in the chart below. That is, they make the mistake of comparing the distance along the green line with the distance along the vertical blue line, and decide that not much of a squeeze has occurred. Instead, they should compare the black vertical line with the blue vertical line. The length of the green line may even be less than the length of the blue line at the same time the length of the black vertical line is two or three times the length of the vertical blue line. The spread between the Bollinger bands at specific points in time is given in the chart below by the black line and the blue line, not by the green line. The green line is not determined at a single point in time. Therefore, the correct procedure is to draw vertical lines at the two dates of comparison and note the difference in their lengths.

2. The scanner is intended to cut down on the number of stocks we have to review, but we don’t want it to do our thinking for us. The user has an opportunity to examine the squeeze relative to a stock’s squeeze pattern and relative to the current context. There are hundreds of stocks that penetrate a band without any squeeze (this is what you get at other websites). A band penetration without a previous squeeze is nearly meaningless. With this filter, we are provided with a handful of stocks to review (the best candidates) rather than hundreds (most of which are of no interest at all). Of the relatively small list we get we will reject some because the squeeze or context is not acceptable (for us).
3. Some signals are generated even though the first band penetration did not just take place but took place several days ago. If the bands still have narrow separation relative to the average separation before the squeeze, we are still interested in reviewing them.
4. A squeeze does not have to last for a week, a month, or any other set period to mean a squeeze has taken place. If the two bands narrow their separation for even a day, that is a squeeze. Why? the Bollinger band equations are based on a 20 day measurement. When a squeeze is registered, it is based on data covering 20 days and is plotted on a chart relative to the period before that. Some traders consider only squeezes that have lasted for at least one or two weeks to be worth while. Others consider any squeeze to be worth while. Rather than filter out all squeezes that have lasted less than several weeks, we have decided to show even those of short duration so that subscribers can decide for themselves which are actionable. Our own traders have had great success acting on very short-term squeezes. Of course, the context of a squeeze is extremely important.
5. The standard approach is to look for squeezes in which the band separation is less than at any time in the previous 6 months. We focus more on the amount of squeeze that is taking place rather than how long it has been since band separation has been that small. The latter will flag stocks with the slightest contraction in band separation if the separation between the bands is the narrowest it has been for 6 months. It is our experience that very good alerts can be based on a significant narrowing of band separation, regardless of how long it has been since the last separation of comparable magnitude. Rather than have the computer automatically eliminate stocks that have had a greater squeeze within the last six months, we want to examine the patterns for ourselves. We really don’t care very much if there has been a tighter squeeze within the last 6 months. We have found that sufficiently tight squeezes (regardless of how long it has been since the last tighter one) are well worth our attention.
6. The alert is given if there has been a Bollinger Band squeeze and the closing price is above the upper band or below the lower band. It does not require that the penetration be the first penetration. If the squeeze is still relatively tight and there is a band penetration for 5 days in a row, then each of those days would result in an alert if the scan were conducted each day. Therefore, you will see some stocks listed for which a band has been penetrated one or more times already. However, if the bands are still in a squeeze pattern, those stocks are still of interest. Hence, they are reported. It is a simple matter to loosen or tighten the squeeze parameters, and we will make such adjustments as the need arises (or if enough subscribers express a desire for a similar type of modification).
Richard Donchian’s 5×20 Dual Moving Average Crossover System (a variation). If the 5-day MA (moving average) crosses from below to above the 20-day MA, if both moving averages are currently rising, and if the 3-day moving average of the volume is greater than the 30-day moving average of the volume was before the last 3 days, an “Up” alert is triggered (the “5×20 Up” alert). The opposite conditions with an increase in volume triggers a “Dn” alert (the “5×20 Dn” alert).
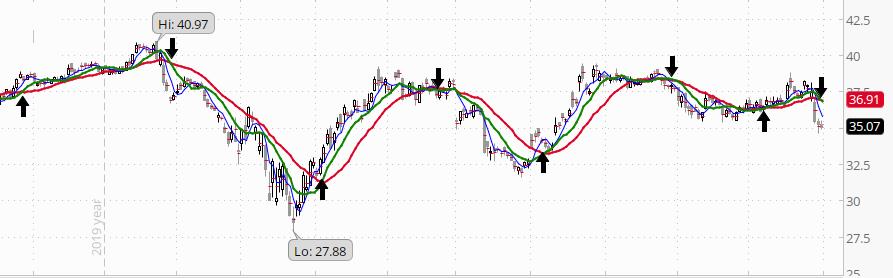
We use the same chart here because the alternating buy and sell signals illustrate the system well. Stock Alerts includes the 5x10x20 Triple Moving Average Crossover System (a variation on R.C. Allen’s 4x9x18 system that is illustrated above). Our tests on thousands of stocks over many years and under a variety of market conditions has convinced us of the power of both the 4x9x18 and the 5x10x20 system. In Stock Alerts, if the 5-day moving average is above the 10-day moving average and the 20-day moving average, and the 10-day moving average has just crossed from below to above the 20-day moving average, a “5x10x20 Up” alert is displayed. If the 5-day moving average crosses below the 10-day moving average and the 20-day moving average, and the 10-day moving average has just crossed from above to below the 20-day moving average, a “5x10x20 Dn” alert is displayed (see the sample table above). Our lists of alerts also show the 1-day percentage change in volume for all stocks generating an alert.
Note: R.C. Allen’s original 4x9x18 system is available as a separate subscription, and is not included with StockAlerts.
StockAlerts is also attractive because …
Our StockAlerts subscription costs less than the price of a subscription to the average monthly stock market newsletter. On January 22, 2001, Money reported on a survey it made of 61 market letters. The average annual subscription price for these newsletters was $220.46. In most newsletters, the author states that he or she thinks a particular stock should perform well over the next year. This is an opinion. It may take the stock six months before it even begins to make a move. StockAlerts, on the other hand, lists stocks that have just triggered an alert (this is a fact, not an opinion). If there is follow through, it will be evident shortly (usually within 2 weeks). You will not have to wait for a year to see if it performs as expected. This should make it easier to find stocks that satisfy the particular requirements of your own discipline. You have our permission to print your own hard copy of the lists from this website (for your own personal use only).
A variety of alerts based on different pre-surge conditions is more likely to provide some worthy candidates for your watch list at a given time. That is, the kind of “setup” that produces the best candidates varies over time with changing market conditions. For example, gap alerts may yield the most attractive candidates at one time, but Bollinger Band squeeze alerts may yield the most attractive candidates at another time. In other words, at any given time, a particular alert system may not yield many attractive candidates but may do so at another time.
More information is available here. The link “More info >>” at the bottom of the page will bring you back to this page.
Download a list of the stocks scanned for our reports.