$25.00
Click on the image to the left
to get a better view.
See description lower on this page.
Description
People use scanners to find gaps, new highs, breakouts, Bollinger band penetrations, or whatever. Why? They look for these situations because they often mark the beginning of a significant move or trend. Those with experience with most scanners know that there is usually a big difference between what they are looking for and the output of the scanner. Not only that, but the conditions searched for often fail to produce the new surge or trend.
However, If a new trend actually does develop after a gap up, a new high, a price breakout through resistance, a Bollinger band penetration, or whatever else a person might try to find with a stock scanner, that new trend will produce a moving average crossover early in its development. Scanning for moving average crossovers will detect all new trends regardless of how they get started.
We have included in this scanner crossover systems with a wide spectrum of sensitivity levels. First of all, the scanner includes R.C. Allen’s 4x9x18 triple moving average crossover system alerts, and we will describe this in more detail later. Alerts also include the 5-day moving average cross of the 20-day moving average (ala Donchian), the 5-day moving average cross of the 50-day moving average, the 10-day moving average cross of the 20-day moving average, the 10-day moving average cross of the 50-day moving average, and the 13-day moving average cross of the 30-day moving average. No alert is generated without a surge in volume on the day of the crossover. We scan thousands of stocks (the database has about 8000).
The scanner’s systems form a kind of “net” that should be able to detect any emerging trend at an early stage of development. The trader can therefore be alerted to the existence of an emerging trend by the more sensitive systems and can review the stock immediately to see if it makes sense to take a position. Alternatively, the trader may decide to wait for the stock to register on another crossover system with which he or she is more comfortable and re-evaluate it then. Obviously, a stock beginning a trend will eventually register on all of these systems at one time or another as the trend develops.
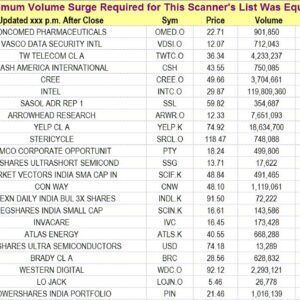
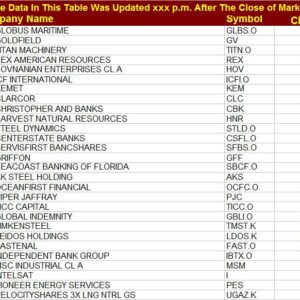
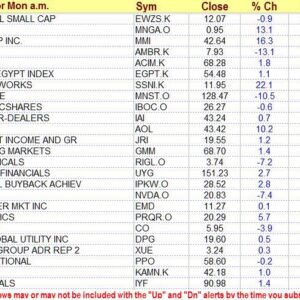
We use volume surge magnitude to rank “alert candidates.” For example, if an “Up” alert crossover has just occurred but the volume has declined, then we would consider the “Up” alert to be unreliable. A volume surge does not guarantee reliability, but we believe it can dramatically increase the odds of reliability. For example, assume the system finds 500 alerts. That is far too many to post. Our way of addressing the issue is to rank all alerts by the magnitude of the volume surge on the day of the alert. The greater the volume surge, the more credible the alert. Thus, the stocks in the top 100 are the “cream of the crop” for that day. By the way, we list up to 100, but the number of crossover events that occur in a given day may be well under 100. For example, on some days the list might have less than 50 stocks on it. Alerts are listed in the order of their volume surge percent (the alert associated with the greatest surge in volume is at the top of the list, regardless of the type of alert that occurred). For example, if there are several stocks that have had a Bollinger band penetration after a band “squeeze,” they will not be grouped together but listed according to the magnitude of the volume surge associated with the event. If there are 50 stocks that generate an alert but only 10 had an increase in volume (the others had a decline in volume), then only 10 will be listed. We indicate for each report the minimum volume surge requirement that was used, but the smallest volume surge listed with an alert may be far greater than the minimum volume surge requirement. We provide the actual volume surge numbers for each of the stocks in the report so you can be more selective if you wish.
We also provide the price change for the day of the report so you can use the magnitude of price change as a filter. Obviously, a crossover with a large price surge is of greater interest than a crossover with barely enough of a price surge to cause a crossover. Crossovers with large price surges are also less likely to whipsaw. This metric could be used in combination with volume change/surge information.
The R.C. Allen Triple Moving Average Crossover System
With this subscription we also list alerts generated by R.C.Allen’s 4x9x18 triple moving average crossover alert system. The system used was first introduced and made popular by R.C. Allen (How to Build A Fortune in Commodities) as an effective tool for trading both stocks and commodities. To create the lists, we scan thousands of stocks. Stocks generating R.C. Allen alerts are ranked in order of the magnitude of the surge in volume that occurred on the day of the alert, with the greatest volume surges at the top of the list.
Please note: Those who are especially interested in R.C. Allen alerts should check the subscription dedicated to R.C. Allen alerts. Stock-Scanner has other alerts that will crowd out many of the R.C. Allen alerts because they may be associated with a greater volume surge. For example, one day we identified the last R.C. Allen alert listed on a Stock-Scanner report. It turned out that it was only number 39 on a list of 90 alerts published for our R.C. Allen alert subscribers.
The Alert System Used is as follows.
1.) An “Up Alert” means that the 4-day MA is above the 9-day MA and the 9-day MA is above the 18-day MA. — If a stock is rising, its shorter moving averages will move up faster than its longer moving averages. Waiting for all moving averages to align correctly gives time for momentum to build, and it helps a potential buyer avoid some false starts. This is one of the ways the strategy incorporates discipline. The alert to a possible “buy” signal occurs when the 4-day moving average crosses above the 9-day moving average. The actual buy signal occurs when the 9-day moving average crosses above the 18-day moving average while the 4-day moving average is still above the 9-day moving average. If at the time the 9-day moving average crosses above the 18-day moving average, the 4-day moving average is below the 9-day moving average, there is no signal unless and until the 4-day moving average crosses back above the 9-day. Conversely, a “Down Alert” means that the 4-day moving average is below the 9-day moving average and the 9-day moving average has just crossed below the 18-day MA.
2.) Furthermore, an “Up Alert” means that the 9-day moving average was recently below the 18-day moving average. — This implies the stock was recently declining and may be just beginning to rise. Here, the idea is to catch a stock at the beginning of a new trend. A “Down Alert” means that the 9-day moving average was recently above the 18-day moving average. This implies the stock was recently rising and may be just beginning to decline.
3.) R.C. Allen said that “In a bull market, the volume of sales should increase as prices rise. If the volume does not increase, it may be a false move or ‘trap.’ Even though your charts may show a ‘breakout’ towards higher levels, the up move should never be trusted unless it occurs with an increase in the volume of the sales.” The same thing can be said of down moves. If volume declines on a down move, that move should not to be trusted. Under the heading “Vol %” we give the 1-day change in volume on the day the 9-day moving average crossed the 18-day moving average.
4.) R.C. Allen only required the alignment of moving averages as described in item 1. What if you have an “Up Alert” in which the 4-day moving average is above the 9-day moving average but declining? This could be an indication that the signal may result in a whipsaw (a sell signal shortly after the buy signal). You can screen out such “setups” by viewing a chart with the 4-day moving average on it. A stock is listed as giving an alert based on a strict compliance with Allen’s system. However, in addition to the proper alignment of moving averages, you may use the 4-day moving average to provide added confirmation of the signal by requiring that it also be moving in the direction of the crossover.
5.) The “Alert” column identifies the type of alert generated. For R.C. Allen alerts, the entries there will be either read “AllenU” (for up alert) or “AllenD” (for down alert).
R.C. Allen’s system has been used successfully by thousands of traders over many years.
The purpose of this scanner is to help you find any stocks that are just beginning a new trend. The components of our scanner all look for crossover events in either direction. The scanner generates an alert for each crossover, names the stock and gives its symbol, identifies the system that generated the alert, identifies the direction of the crossover, gives price and volume surge information, and provides a Relative Strength (RSI) measurement.
Before ordering, see our policies regarding automatic renewals, cancellations, and refunds
Return to the “Products & Prices” page