The Valuator

$25.00

Click on the image to the left
to get a better view.

See description lower on this page.

Description

Watch-list Candidates & Target Prices
Fundamental & Technical Measurements.

The Valuator Illustrated
The report subscribers get now has an additional column in which we identify the industry.

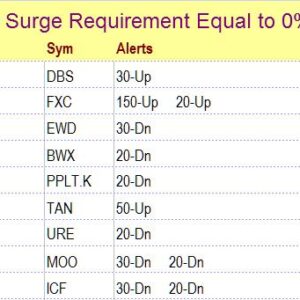
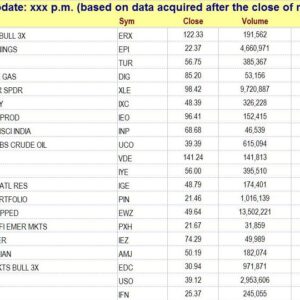
The Valuator is published weekly, and it provides numerous measurements of stock behavior and value. These include the  “►” and “♦” alerts, the Eight “Flag” indicators that show where a stock is in its price cycle (all stocks cycle), the “Trends” indicator that maps the direction of 3 consecutive 20-day trends, the “Direction ± (%)” indicator showing the direction and change of the most recent 20-day period, the “20-Day Low,” the distance in % before a stock reaches its price Center of Gravity (the price about which the price oscillates (like a moth circling a light bulb) and the price most likely to be revisited by the stock, The C.G. or “Center of Gravity” or price of highest probability , PE, Dividend Yield, Earnings Yield, Strength Rank, Value Rank (based on a composite of valuation measurements), and Velocity Rank.  The Valuator is spreadsheet sortable.  However, we do presort the data in several categories, listing the top 38 in each category (for those who do not want to sort a spreadsheet).  The Valuator gives follow-up information every week.

“Fair Value” vs. “Center of Gravity”

People buy high and sell low because at any given time they have no rationale for judging where it is relative to its “fair value.” The price of each stock swings up and down between being “overvalued” and “undervalued” relative to ANY measure of the underlying value (the “fair value”) of the stock. The market’s concept of “fair value” for a stock is not constant. “Fair value” is what the market thinks it is. Like it or not, “fair value” is tied to market sentiment. People use various measurements and ratios to express “fair value” and those metrics give a sense that fair value is something that can be quantified. However, “fair value” always has a context that in some way shapes the meaning of “fair value.”

In The Valuator, there is a column that shows specifically how far a stock must rise (in percent) to reach our estimate of its “Center of Gravity.”  The “Flag” indicator is another way this issue is addressed.

FLAG (Column D): This column shows where a stock is as it oscillates above and below its “Center of Gravity.”  “Center of Gravity is what we use for short-term to intermediate-term “Fair Value.”  This is the price most likely to be revisited within the next few months.  The traditional “Fair Value” may take years to reach and may turn out to be inaccurate after a long wait.  Our “C.G.” is based on probability and statistics, not on analyst’s estimates of earnings for the coming year nor on last year’s earnings data.  Rather, it is based on the stock’s behavior over the most recent two years.  Our Flag alert indicates where a stock is in its cycle. Imagine a stock swinging up and down between extremes and that across the middle of these swings is a horizontal line marking its “fair value.”   In the image below, substitute the words “Center of Gravity” for “Historical Fair Value.”

This chart illustrates the 8 phases a stock goes through as it cycles between being low and rising and high and falling. These phase each stock is in is identified by The Valuator.

This column defines eight positions in a stock’s cycle: “HF” = High and falling (it is at or above its expected high and it is on its way down), “OF” = Overpriced and falling (it is above the “Center of Gravity” but below its expected high and it is declining), “UF” = Under-priced and falling (it is below its “Center of Gravity” and falling, “LF” = Low and falling, “LR” = Low (below its expected low price) and rising, “UR” = Under-priced (between expected low and its “Center of Gravity”) and rising, “OR” = Overpriced (but below its expected high) and rising, and “HR” = High and rising.

We know of no other market letter that provides as much information (with regular follow-up) at anywhere near the low price of The Valuator.  However, there are many market letters of about half the size (with a lot less information) that are available at about twice the price.

NOTE:
Analysts tend to base their reports on the past year (outdated) or make estimates for the next year (they are notoriously wrong).  For over 30 years, our valuation models were based on financial data for the last 6 months combined with analyst estimates for the next 6 months (they are more accurate when looking ahead only 6 months).  However, we have decided to make a significant change.  We wanted more accurate, more timely, and more reliable data and price targets.

For more information on why we changed from “Fair Value” valuations based on earnings and other fundamental information to “valuations” based on statistics and the mathematics of probability click on Center of Gravity

You must be able to open an Excel spreadsheet on your computer to be able to download the spreadsheets of The Valuator.

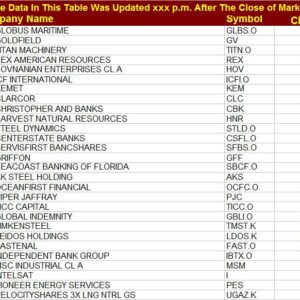
See List of Stocks Tracked by The Valuator

This description is barely an introduction.  It is only a brief excerpt from the much more complete description and explanation of features along with illustrations that can be viewed at The Valuator 

Before ordering, see our policies regarding automatic renewals, cancellations, and refunds

More info >>

Return to the “Products & Prices” page


Published by Dr. Winton Felt

Dr. Winton Felt Educational background. Dr. Felt did his graduate level studies in Systems Engineering/Applied Mathematics, English, Management, and Clinical Psychology. During a good portion of the time he was involved in his graduate studies, Dr. Felt also operated his own business, teaching advanced reading and study techniques at four colleges in Southern California, and conducting special classes for various Christian organizations. General history of securities-related experience. Felt began his study of security trading patterns (emphasizing the “point-and-figure” method and outcome probabilities associated with various patterns) when he was in his early 20's. He became a professional in the financial services industry in 1985. He did his basic brokerage training at Merrill Lynch and achieved perfect scores on the “Series 7” in the areas of “Portfolio Analysis” and “Investment Strategies.” At Merrill Lynch he became the “Mutual Fund Coordinator.” A few years later, he was recruited by Bateman Eichler, Hill Richards (Everen Securities) to finish the development of a stock-trading system and to use it in managing a pooled account. He then founded Asset Management Systems and continued his work on the development, analysis, and evaluation of investment disciplines and strategies. He used multivariate analysis to test the profitability of more than 50,000 investment strategies. He then used the results of his analyses to design high total-return strategies. He also wrote algorithms to enable a computer to search through thousands of stocks to identify those that have any of a variety of behavior patterns known as "setups," price and volume configurations that most often occur shortly before a price surge. Dr. Felt created the Market Bias Indicator (MBI), also known as the Felt Oscillator, the Force of Trend (Group Pressure Gradient) indicator, and a procedure for discovering what he calls "Key Intraday Levels." He managed portfolios, created investment disciplines, created the publication originally known as Value Indicator (later renamed The Valuator), created what was originally a 70-page weekly publication known as StockAlerts (our present StockAlerts subscription service is a derivation and subset of this no longer available publication), and was the founder of Stock Disciplines, LLC. Work and licenses before becoming the principal officer of Stock Disciplines, LLC. Dr. Felt has held various licenses as an investment professional. During the years immediately before he became the principal officer of Felt Financial, LLC. (through which he managed investment advisory accounts), Dr. Felt held a “Series 7” General Securities license and was registered with the NASD. He also held a “Series 24” license issued by the NASD. A “Series 7” will qualify a person to be a “Registered Representative” or “Investment Broker,” and is the license held by the more qualified “brokers” at major brokerage houses. This license is a prerequisite to sitting for the “Series 24” exam. The “Series 24” license is required for those who supervise other brokers (securities regulations stipulate that every Broker/Dealer firm must have at least one individual who is licensed as a "General Securities Principal"). Having both a “Series 7” and a “Series 24,” Dr. Felt had the NASD designation “General Securities Principal” (it should be noted that registration and licensing by the State of California, the SEC, or the NASD does not represent a mark of approval or endorsement by these regulatory bodies, but that certain standards of knowledge and other requirements have been satisfied). During this time, Dr. Felt was affiliated with Titan Value Equities Group, Inc. as a Registered Representative, a Registered Principal, an Advisory Associate, and as the manager of an Office of Supervisory Jurisdiction. Felt Financial, LLC. (of which Dr. Felt was the principal officer), remained in the investment advisory business as a Registered Investment Advisor until December 31, 2005. After that date Felt Financial, LLC. became Stock Disciplines, LLC., and the firm (and Dr. Felt) stopped providing investment advisory services (use the link below for more on why the advisory business was abandoned). Dr. Felt has also conducted investment strategy seminars and tutorials for investors and brokers. Past Affiliations. Biola University in La Mirada, Asset Management Systems located in Costa Mesa and Newport Beach, and Felt Enterprises with primary locations in Oceanside and Carlsbad in California, USA. Articles Published. To see a few articles written by Dr. Felt, click on Articles. If you know or have ever met Lawrence, Carolyn, Winton, Shirley, Wendy, Anthony, Larry, or Gail, we have a message for you. Read The Message For more on Dr. Felt's strategy testing and why he stopped managing money for others, see item #10 after clicking on Leaving the advisory business. Return to About Us for information about the company. View