$19.00
Click on the image to the left
to get a better view.
See description lower on this page.
Description

Stops
The Stops tool makes it easier to know where to place each higher stop loss as the stock rises, while simultaneously factoring in the volatility of the stock. No math is needed. The tool automatically incorporates a stock’s volatility in its calculations, using your choice of method, and provides the needed stop loss data as determined by the stock’s own behavior. The Stops tool facilitates a disciplined approach to trading and investing. It helps eliminate emotion from the sell-decision.
One problem traders and investors face is how much to let a stock decline before selling. Our tool addresses this issue. The ideal sell strategy will minimize the loss if the stock plummets but still give the stock room for normal fluctuations while it continues to climb. Correct sell order placement is one of the most important disciplines a trader can learn. The problen is that in order to determine the correct placement of a volatility-adjusted stop-loss, it is generally necessary to use some math. The Stops tool makes the calculations automatic. With this tool, stop losses can be computed on the basis of either of two very different approaches to stop loss computations. Each of these approaches has an infinite range of adjustment possibilities (so you can adjust them to reflect your own tolerance for risk). This is possible because a weighting factor can be applied to the volatility measurement. The weighting factor can be any positive number or decimal (to as many decimal places as you like), enabling the user to “fine tune” his stop loss settings. Stops does all the math for you. All you have to do is tell it what you want.
Stop losses based on volatility measurements are much less likely to be triggered by a random fluctuation in price. Most expert traders and investors will use direct measures of a stock’s volatility in the placement of their stop losses. A very popular method for computing volatility is to compute the ATR (the Average True Range). An alternative for measuring volatility that has strong support from statisticians is the computation of the standard deviation. Stops can use the standard deviation of the TR to calculate stop losses rather than Wilder’s average of the True Range. Traders and investors have learned that the standard deviation is an accurate and powerful tool for setting stop losses. Stops provides a means by which you can use either approach without having to perform the calculations. Below, we will discuss each procedure.
.
General description: The Stop Loss
Whether a person holds stocks for a few days or for many months, he must make trades. One of the rules of good trading, and of good investing in general, is to “limit your losses and let your profits run.” This phrase is often heard in investment circles, but it is not often implemented with discipline. It’s another way of saying that, for the best returns, a person should hold onto a stock only as long as it is climbing and sell quickly when it starts to decline. The use of a stop loss order that follows a stock up as it climbs higher and automatically sells when the stock falls is one of the best strategies known for doing precisely that. It is also the easiest to implement. Because Stops makes the computations automatic, you can spend your time on other parts of your strategy or on refining your discipline. Stops relieves you from the stress of determining where to place your sell order each time the stock ratchets up to a higher level.
The measurement of volatility, tells you what “normal” fluctuation is for a particular stock. Conversely, it also tells you what is not normal for the stock. Through our training programs we learned that most people do not know how to measure volatility. If they use stop losses at all, they tend to use a rather simplistic one that ignores the volatility of the stock. Therefore, their stops tend to be triggered too quickly because they are too close to the stock or too late because they are too far from it. Even those who have the mathematical know-how to make the necessary computations find it tedious and time-consuming to repeatedly compute revised volatility-adjusted stop losses for each position each day as it works its way up to higher levels.
Understandably, traders and investors would much rather spend the time searching for attractive “setups” or planning their next move. Unfortunately, the use of “sloppy stop losses” explains why so many people get much lower performance from their portfolio than they should, and the fact that so many use no stop loss at all explains why so many get “killed” in the market. Adopting a habit of always using correctly placed volatility-adjusted orders to sell could add an extra 10% (and possibly a lot more) to the return of a portfolio. Traders need to be able to find the optimum selling point (for every stock for each day) without having to make time-consuming statistical calculations.
The Stops Solution
Traders do not want to spend their time studying program syntax and non-intuitive procedures that do not follow the standard rules of algebra, and we have found no inexpensive easy-to-use tool we could recommend that will automatically do the math required to compute a sophisticated stop loss. So, we developed one. We call it Stops. Stops is based on and makes use of an Excel spreadsheet. It provides two very different ways to compute a stop loss and each of these can be “fine-tuned” to reflect the user’s tolerance for risk. All you have to do is enter a few letters (“H,” “L,” or “C”) in cell C-1 to indicate that you want your stop loss calculated relative to the high, low, or close. For ATR calculations, you would enter “5,” “7,” “14,” or “20,” in cell C-2 to indicate that you want your stop loss calculated on the basis of the last 5 days, 7 days, 14 days or 20 days. You would enter a number (usually between 1.000 and 4.000 in cell C-3 to “weight” the volatility measurement (volatility x 1.58, volatility x 3.25, etc.).

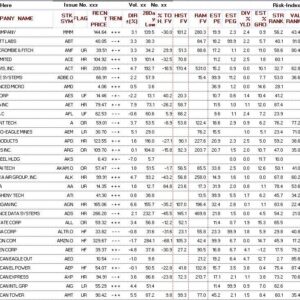
As you can see in the above illustration, the user can enter a stock’s symbol in cell D-1, and the desired data will appear in the blue area. Alternatively, he can simply scroll down the list to find the stocks of interest. All stocks on the list will show data generated by the settings entered by the user.
In the Goldenrod colored strips, you will see “Price,” “VA,” “Price-VA,” and “Price + VA.” The letters “VA” stand for “Volatility Adjustment.” If a stock has been in a downtrend and an investor is wanting to determine when a reversal has taken place, he might want to calculate a buy price by using a multiple of the volatility measurement. Instead of calculating the price for a stop order to sell, he may want to calculate a price for a stop order to buy. Also, there are times when short sellers will want to add the VA rather than subtract it. Under these conditions, the user will be interested in the data under “Price + VA.” Those who use the tool only for calculating stop loss prices for long positions will focus on the “Price – VA” column.
The above illustration shows the tool configured for ATR stop losses. These are Stops based on Wilder’s original formulas for Average True Range. Stops does not modify Wilder’s methodologies or use shortcuts. It uses his procedures of calculation as he intended. Note the gray box in cell G-19. If the user enters an “S” in that box, Stops will re-configure itself to generate data based on the standard deviation of the TR rather than Wilder’s method of averaging the True Range.
With the “S” in cell G-19, Stops will ignore any entries in cell C-2. Computations for the standard deviation are based on 50 days of price activity. Of course, less data will be used for stocks that began trading only 30 days ago, etc.
Stops will also show you the data used in computing stops. When the user scrolls to the right, he can view the following data.

The user can see the ATR for the 5-day, 7-day, 14-day, and 20-day periods for all the stocks in the Stops database. He can also see the standard deviation of the Wilder True Range and the latest computation of the Tue Rnge.
Stops is intended for people who do not want to spend a lot of time making mathematical calculations or who do not want to pay a large fee to use a program that probably will not make it any easier to compute a good stop loss. Even with very expensive software, either because of the strange non-intuitive syntax required by the program or because of the lack of sufficient mathematical expertise on the user’s part, it is often very difficult for most users to write a volatility-adjusted stop-loss formula that the program will use correctly. That is why so many investors rely on “eyeballing” charts (this can be quite sloppy and result in more than necessary loss) or on making simplistic computations manually. Manual calculations have to be very rudimentary because the more sophisticated computations tend to be too time-consuming.
Rudimentary stop losses are usually the first to get triggered unnecessarily because of market “noise.” These stop losses may also give up far too much money when they are triggered. Even one excessive loss of .65 on a 500 share trade would cost more than the price of using the tool for a full year. Multiply that by the number of positions incorrectly stopped out in a year to get an idea of the potential savings possible with Stops. How many people want to take the time to compute a stop loss based on standard deviation? How many know how to compute a standard deviation? Those who know how do not want to spend all the time it would take to make the computations for all their positions, let alone repeat those calculations over and over again for each stock as it rises. They would much rather spend the time doing research, screening stocks in search of good set-ups, or planning trade strategy. That’s the beauty of Stops. With Stops, you can get the more sophisticated stop loss calculations without knowing how to write formulas and without learning arcane program syntax. You simply enter instructions and Stops will do the rest based on the simple instructions you give it.
Most successful investors prefer to place their stop loss just below a recent minor low. A minor low suggests that there is support at that level. An alternative approach is to place it under a significant trendline. However, there are times when the trader can find no recent minor lows or trendlines to use as a reference. At such times, a “mathematical stop loss” can be very useful. Stops can make computations that are based on statistical probabilities. For example, in a normally distributed population, measurements that are 2 standard deviations above the average (you don’t have to know what this means) occur about 2% of the time. That is, in any random sampling of 100 people, the probability is that 2 of them will score at that level (whether it is height, weight, IQ, strength, or whatever). Similarly, 2.5 standard deviations represent a frequency of occurrence of about 6 times out of 1000, and 3 standard deviations represent a frequency of 1.3 times out of 1000.
Apply the same concept to stocks. We can use measurements of dispersion like the standard deviation in our equations so that the stop losses generated will automatically adjust to the changing volatility of a stock. Thus, by applying the appropriate multiplier to the standard deviation portion of the equation, a person can set the stop loss so that it is unlikely to be triggered because of the normal volatility of the stock within 50 days, 100 days, or whatever.
However the market does not exhibit perfect symmetry in the dispersion of price behavior (you do not have to know what this means either, just follow along with us). Therefore, a perfect calculation of probable price excursions is not possible. Nevertheless, for practical purposes, the virtually unlimited range of adjustment possible with this tool renders such issues moot. Measurements of dispersion such as the standard deviation are the most useful tools available for making such calculations. They can indeed be used effectively to set stop losses that have a low probability of being triggered by most random spikes in the stock’s normal price behavior.
Stops has a Multiplier function (cell C-3 in the first two images above) by which you can adjust the number of standard deviations or ATRs that will be used when the stop loss is computed. This tool can be used to find optimum stop losses. The key is to use a stop loss that is as close as possible to the current price (to minimize loss if the stock suddenly plunges) but that is not so close that it is likely to be triggered by normal volatility over the expected holding period of the position (to avoid unnecessary selling). When a stop loss is triggered, it should be for a good reason. There will always be some occasions when a stock will have a downward spike, trigger any reasonable stop loss, then climb to a much higher level. It is impossible to completely eliminate such occurrences. Though they cannot be eliminated, they can be made far less likely. Stops is a flexible and easy-to-use tool for generating stop losses shaped by the user to meet his or her own trading needs.
ATR Stop Losses
The True range is defined as the greatest the following:
A. Most recent day’s high minus the most recent day’s low
B. Absolute value of the most recent day’s low minus the previous close
C. Absolute value of the most recent day’s high minus the previous close

The Average True Range (ATR) is the average of the True Range over a given period. It is a measure of volatility first introduced by J. Welles Wilder in his book, New Concepts in Technical Trading Systems. Wilder recommended a 14-day average of the True Range. (Periods ranging from 5 to 21 days have been recommended, depending on the nature of the security traded and the anticipated holding period.) According to Wilder, large ATR values tend to occur at market bottoms after a panic sell-off (volatility is high). Small Average True Range values tend to occur when volatility is low. An example would be during times of prolonged sideways movement (as when a market is topping out or undergoing consolidation).
Stocks will sometimes gap up or down. A volatility formula based only on the high-low range would not accurately capture volatility when gaps occur. Wilder’s Average True Range can capture this “missing” volatility because his True Range automatically factors in any gaps. The Average True Range measures how much fluctuation or “noise” there is in a trending stock’s behavior. If a person wants to place his stop loss outside this envelope of noise, then he will multiply the ATR by a factor greater than 1. For example, he may multiply the ATR by 1.5 and use the result to calculate his stop. This would help prevent getting stopped out prematurely and will also limit his risk in the trade. Some will prefer a stop that is a greater distance outside the noise envelope and multiply the ATR by a number greater than 1.5. Wilder recommended a multiplier of 3 for intermediate-term to long-term investors. The choice of a multiplier is an individual matter that should be based on the individuals investment time horizon and tolerance for risk. Since there is never a guarantee that a declining stock will recover, the more a stock is allowed to decline, the greater the risk assumed by the investor. This risk must be balanced by the desire to avoid selling too quickly and without sufficient reason. These considerations cannot be made for you. However, lower on this page, we have provided some charts showing where the stop loss would be for various settings.
Wilder’s Average True Range was not computed by simply adding up the True Ranges for 14 days and then dividing by 14. He has a unique method of averaging. Stops uses the same unique methodology recommended by Wilder. Many who attempt to use Wilder’s system do not perform the calculations correctly. However, Wilder’s methodology has become a favorite among investors and traders who know how to perform the calculations correctly, because of its effectiveness and relative simplicity.
Standard Deviation Stop Losses
Wilder devised his concept of the Average True Range at a time when people did not have personal computers to handle more complex equations. However, the standard deviation is the statistical tool used by statisticians in their measurements of variance. They consider it to be superior to any procedure based on averaging. Stops enables the user to choose the standard deviation to determine statistically valid stop-loss levels. In the opinion of most statisticians the standard deviation is the best and most statistically valid measurement of variance available (for shares, “variance” relates to the magnitude of price excursion).
It is a fact of nature, just as Pi (π) is the same regardless of the size of a circle, that whenever we measure a randomly selected group for some trait which each member of the group possesses in varying degree, we may expect most of the measurements to bunch around the average, while the remainder tapers off gradually toward both extremes of the distribution forming a bell-shaped curve. That is, the more extreme the measurements (extremely small or extremely large) the less frequently they occur. If you plot a bell-shaped curve, most measurements will be grouped near the center. The more people there are that are “normal,” the larger the group at the center. There are many more men who are 6′ tall than who are 7’2″ or 3’5.” By using the standard deviation as a measure of variance, we can know the probability of finding trait measurements of any magnitude.
For example, in any large normally distributed set of trait measurements we know that trait measurements that are ½ standard deviation or more greater than the average (B in the chart) will occur 30.85% of the time. Again, this is a law of nature. Similarly, we know that
1. measurements 1 standard deviation or more greater than the average occur 15.87% of the time.
2. measurements 1.5 standard deviations or more greater than the average occur 6.68% of the time,
3. measurements 2 standard deviations or more greater than the average occur 2.28% of the time,
4. measurements 2.5 standard deviations or more greater than the average (F) occur .62% of the time, and so on.
Our stockdisciplines.com traders can use this information to approximate the probability of the occurrence of a price spike of a specific magnitude (as represented by its distance from the norm in standard deviations). You can do the same thing. The word “approximate” is used because stock price variations are not exactly “normally” distributed, but they are close enough for our purposes. Assume for a moment that stock price spikes precisely followed a “normal” distribution or bell curve. Then a stop that is set at 1.5 standard deviations from the average price would be triggered approximately 6.68% of the time. Assume that during the last 20 days there were no special news events that inordinately influenced the stock and that the same conditions prevailed over the next 100 days. In that case, spikes large enough to trigger a stop set at 1.5 standard deviations would probably occur about 6.68 times in 100 days or about once every 15 days simply because of the normal volatility or “noise” in the stock’s behavior. If we use 2 standard deviations, then a spike large enough to trigger the stop would occur about once every 50 days. For a more complete discussion of Standard Deviation and its application, see stop-loss-probabilities
Because Wilder’s True range effectively compensates for gaps over the shortest period possible, Stops Uses Wilder’s True Range as its basic analysis unit rather than the range over one or two days. Some use two days and add a day when gaps occur, but in our view this is a coarser approach (lacking the definition) of using Wilder’s True Range. Stops calculates the standard deviation of the True Range over a 20-day period and adds it to the Average True Range. The Formula is ATR + (f x StDev) where f is the multiplier or weighting that is applied to the standard deviation. The result is added to or substracted from the high, low, or close.
This tool is probably the easiest tool available anywhere for calculating stop losses based on the standard deviation. It is so simple to use that a User’s Guide is not necessary. All explanations needed are included on this page.
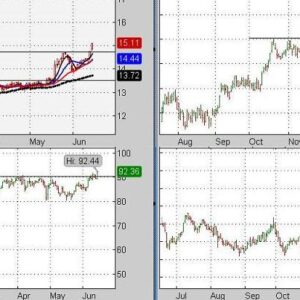
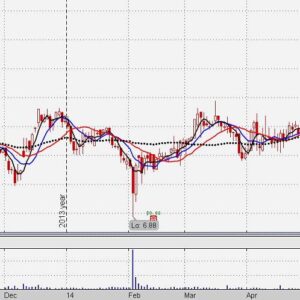
Because it is difficult to visualize the probable real-life experience of setting a stop loss at any standard deviation multiple, we have some charts below where you can see a red stop loss line below a stock’s price action. The charts show how various multipliers determine stop loss placement.
Stop Loss Placement
To give you an indication of the effect of different multipliers on stop loss placement, we have found a stock with numerous reversals to illustrate the point. Below are five charts showing a stop loss relative to the closing price each day (red line). They show stop losses calculated by multiplying the ATR by 1, 2, 3, 4, and 5, respectively. At the time we made these charts, we did not have the standard deviation calculator in its present form, so we did not generate charts for this procedure. However, you can make use of the charts in estimating the multiplier you want to use for standard deviation stops. For example, in one test we found the ATR stop adjustment for a multiplier of 3 was 4.09 points. With similar settings, the standard deviation stop adjustment was 3.95 points. Changing the standard deviation multiplier to 3.15 gave a stop adjustment of 4.09, making it identical to the ATR stop loss. The two approaches may not always be so similar in their results. However, the point here is only that the charts can be useful when using either approach.
In using the charts below, imagine you have bought at any place on one of the charts. The red line directly below the price bar on the day of purchase represents your stop loss on the purchase date. As the stock rises, you adjust your stop loss accordingly, using your chosen multiplier and the ATR for the current day. Eventually, the stock will decline. When it drops enough that it reaches the level of the highest point reached by the red line since your purchase, the stop loss is triggered and the stock is sold. Most people place the stop order to sell with their broker so that they do not have to monitor the stock during the day. Then, in the evening, they adjust the stop loss for the next day. However, those who are concerned that intraday volatility will unnecessarily trigger a stop, will use “mental” stops, and wait to see where a stock closes. If it closes below the computed stop loss, they call their broker and place a sell order.
In the following illustrations, the red line rises and falls with the stock. In actual practice, stop losses should only be raised as the stock rises. They should never be lowered. It is always at the highest level reached since purchase. When the stock declines, the stop loss does not. However, if we did that with the illustrations, the red line would go flat or disappear the first time the stop is triggered. This way, you can imagine buying at any point on the charts.
1 x ATR

2 x ATR

3 x ATR

4 x ATR

5 x ATR

Fibonacci Retracement Levels

It is often difficult to find a good entry point when a stock is moving up strongly. Traders who expect a stock to continue in a strong advance often buy a stock on a pullback to just above a Fibonacci retracement level and place a stop just below it. If that support does not hold, they will be stopped out at a price only a little below their cost. Stops makes it easy for you to determine Fibonacci levels. It should be mentioned that the ATR and standard deviation stop losses are far more reliable than Fibonacci stops. However, Fibonacci levels can be useful for traders focusing on very short-term price movements. As explained above, they can also be useful for determining entry points. To generate Fibonacci retracement levels, enter the high and low prices of the stock’s most recent significant move in the boxes provided. Various Fibonacci levels will be displayed. Calculations are displayed to 4 decimal places. Stops should be below support rather than exactly at or above it for a security in an uptrend. Most traders will place their stops at some distance below the calculated levels. The amount of “cushion” a trader uses will generally depend on tolerance for risk, time horizon, and the particular trading discipline used. For a security in a downtrend (one you have sold short), you would reverse your procedure. That is, the stop should be above the Fibonacci resistance level if you have shorted a stock in a downtrend. In a downtrend, the lowest price reached in the current downtrend should be placed in the “High” box (as illustrated above) and the highest price reached before the downtrend started should be placed in the “Low” box.
Pivot Points
The pivot point is a recent addition to the data provided in Stops. A pivot point is a price level that is used by traders as a predictive indicator of market movement. A pivot point and the associated support and resistance levels are often turning points for the direction of price movement in a market. Prices tend to swing between two levels. For example, if a price is right at the first level of support (“Support 1”), the probability is that it will move back toward the “pivot point” These levels are very weak, and have most relevance for intraday action (day-traders). In an up-trending market, the resistance levels may represent a ceiling level in price above which the uptrend is no longer sustainable and a reversal may occur. In a declining market, the support levels may represent a low price level of stability or a resistance to further decline. Pivot points were originally used by floor traders in setting key levels. Before the market opened, floor traders would calculate the pivot points for the day. With these pivot points as the base, additional calculations were used to set support 1, support 2, resistance 1 and resistance 2. These levels could then be used as trading aids throughout the day. The resistance levels are where sellers are likely to enter the market, depressing prices. Therefore, it is significant if a stock can push its way through the selling pressure. It takes buying demand to push shares higher through levels at which sellers are waiting. Likewise, the support levels are where buyers are likely to enter the market, exerting upside pressure on prices. Therefore, it is significant if a stock declines through the buying pressure. It takes significant share selling for shares to continue dropping, even through levels at which buyers are waiting.
If you scroll to the right in Stops, you will see the following.

Where S1 and S2 are the first and second levels of suppot, and R1 and R2 are the first and second levels of resistance. The pivot point is located just to the left of “Ticker Symbol” column. However, it is not necessary to scroll to the right and look up the pivot data for each stock. When a symbol is entered in cell D-1, the pivot point data for that stock is automatically shown in Cells G-41 to G-51 as follows.

If an incorrect symbol or if no symbol is entered in Cell D-1, then there will be no data in the Pivot Data Module of Stops. Where the blue numbers are located in the above image, there will be blank spaces.
1. There is within Stops all the data needed to generate stop losses for virtually any stock traded on any U.S. exchange. We generate new data daily, transfer it to Stops, and provide these updated copies of Stops on a daily basis. The updates occur when we update the data for all subscribers after the close of market. Conventional stop loss calculators require that the user enter Open, High, Low, and Closing prices every day. Doing this every day for all the stocks in a portfolio can be a time-consuming chore. Now, the user of Stops does not have to do any of that, because the user gets fresh data automatically on thousands of stocks when he downloads Stops. There may be a few expensive programs out there that will download the data rather than requiring manual data entry. However, we believe that downloading Stops will take less time than those programs would require to download data. For an example, downloading a copy of Stops takes approximately 5 seconds. The time will vary, depending on the configuration of your system, but the download time is very quick. All the user has to do is download a fresh copy of Stops each day..
2. The management of a list of stocks that will be tracked by the calculator is eliminated, because it is not even necessary for the user to add stocks to or delete them from a list for tracking purposes. Virtually all stocks traded on a U.S. exchange are included in each copy of Stops, and the data on each is current. The user can either scroll down the list of stocks or he can simply enter the symbol of the one for which he wants the data.
3. There is no longer a need for the user to commit to, and pay for, six months or a year in advance. The subscriber can pay on a monthly basis and cancel at any time.
4. Stops will show stop loss placement relative to the high, low, or close, and the user can apply a virtually unlimited range of weightings to the volatility measurement.
5. Stops can calculate for long or short positions.
6. Stops can calculate Fibonacci retracement levels and pivot point supports and resistances.
7. We no longer tie Stops to a single computer of the user. If the user has two computers, he can use Stops on either or both. Stops can be used on any computer that has Excel 2003 (or later) installed on it.
Thus, Stops is now a subscription service for which the user pays a monthly fee just as subscribers do for any of our other subscriptions. A person can cancel at any time. When an individual cancels a subscription, the cancellation will become effective at the end of the current paid-for period, and the subscriber will have access until then. There is more information about this on our “Refunds & Policies” page. Each day, the user downloads an updated Stops file. This tool is extremely easy to operate. It is fast, it is time-efficient, and it does the calculating for you.
The Database
We start with a Reuters database of over 8,000 stocks. These are all stocks listed on a U.S. exchange, some of which are foreign. We remove all preferred issues because of the difficulty of finding charting sites where they can be charted (because of their unusual symbols). If the company has preferred shares, it is extremely likely that they also have common shares for which it is easy to obtain a chart. Also, we believe common stock to be a better trading vehicle. We then delete all stocks that did not trade on the most recent trading day. Stocks that did not trade on the most recent trading day may be having troubles with regulators or exchanges. They also may have stopped trading altogether but remain in the database because Reuters has not yet removed them. In iny case, we prefer to avoid stocks having difficulty staying listed or that cannot maintain daily activity/liquidity. We review and update our universe of stock candidates (using the above procedure) daily. When we update our universe of stock candidates, stocks previously deleted may be included again if the problem that caused their deletion has been corrected. Because some stocks that are included in the final version of the database trade only a few shares a day, you must check the daily volume of a stock to make sure it has sufficient “liquidity” for the trade you wish to make. Most experienced traders avoid stocks that do not daily trade at least 100 times the number of shares they want to buy. Many have much stricter requirements.
Changes In Our Stop Loss Calculator
Our previous stop loss calculators required that the individual enter data every day for each position. This data consisted of the date, open, high, low, and close. Entering that data or downloading it is time-consuming. The new Stops already has that data, and it is updated daily. You do not have to know how to calculate the Average True Range with Wilder’s formulas or how to calculate the standard deviation. We do all that for you. All the user has to do is go to the “Subscriber Section” and download the updated spreadsheet. It takes less time to download the spreadsheet than it would take to download the data. That’s all there is to it.
Our previous stop loss programs based on Excel had to protect against hacking and piracy because they incorporated our proprietary formulas and procedures. For protection, we had to use strong encryption or other techniques. We also removed the menu (command ribbon) as well as the column and row headings. In addition, we had to prevent access to the macro (VBA) code. The new Stops tool does not require any of these protections. The user has use of Excel’s menus and headings.
Because we could not remotely turn off our previous stop loss programs, they had to be pre-programmed to turn themselves off after six months or a year. That means the user had to keep renewing a license at the end of each license period in order to keep using the tool. That was anoying to some long-time users, and it is no longer necessary. The new Stops is available like any of our other subscriptions, and the fees are charged in the same way. A person is not “locked-in” for six months or a year.
Summary
Stops will calculate volatility-based stop losses in reference to the stock’s high, low, or close. To “tell” Stops which approach you want to use, simply enter “H,” “L,” or “C” in cell C-1.
Stops can calculate ATR stop losses based on the most recent 5 days, 7 days, 14 days or 21 days. Just enter your chosen time period into cell C-2. It can also calculate stop losses based on the 20-day standard deviation of the stock’s price activity.
You can “weight” the ATR or standard deviation by using a multiplier. In Stops, the multiplier does not have to be an integer. For example, 1.35, 2, 2.46, 3, 1.9, and .82 could all be acceptable entries for cell C-3.
When you enter your settings for calculating the stop loss, the calculation will be applied to all stocks in your downloaded spreadsheet. Since it is highly probable that all stocks in your portfolio are included in this database, your chosen parameters will likely be applied simultaneously to all the stocks in your portfolio.
You can then scroll up or down to find the stop loss setting for each of your stocks.
However, it is not necessary to scroll. For example, you may enter a stock’s symbol in cell D-1. The settings for that stock will appear in the light blue strip in rows 6 and 7. If nothing appears, it means the symbol entered is not recognized by the calculator. Scroll down, find the stock, and note the symbol used by the calculator. Enter that symbol, and the data will appear in the blue strip. The names of stocks will often be followed by the letters “ORD.” “ORD” means “Ordinaries” and is the British equivalent of “Common,” identifying the shares as common shares rather than preferred shares. We use the Reuters database of more than 8,000 stocks, and Reuters is a British company. Most of the time, you will not see these extenders, because we try to remove them before uploading Stops to the Website.
Each day, before you download Stops, check the “Home” page of our site to see what date is posted in the first paragraph of our comments. That is the date of the data currently being used by Stops. Alternatively, check cell C-4 of the calculator. The data used by the calculator was accumulated after the close of market on the date posted in cell C-4.
This tool is extremely easy to operate. It is fast, and it does the calculating for you. To use Stops, you must be able to open and use an Excel 2003 spreadsheet. We use the older version of Excel so that people with older versions of Excel can use the tool. Those with later versions of Excel should also be able to use the older spreadsheets. Older versions of Excel cannot work with spreadsheets created in the newer formats of the latest versions of Excel.
The use of Stops for a year costs much less than the price of a subscription to the average stock market newsletter. The average market letter consists of 8 to 12 pages of opinion. On January 22, 2001, Money magazine reported on a survey it made of 61 market letters. The average annual subscription price for these newsletters was $220.46. We have not checked prices lately, and we are not aware of any more current surveys, but a simple cost of living adjustment through February of 2020 would increase the price to $448.20. As of February, 2020, a couple can buy tickets for one day at Disneyland for $418. The money spent for two tickets to Disneyland for one day pays for a few rides and maybe a few moments of pleasure. The fees charged by vendors are additional expenses. The price of using Stops for a full year is only $228 ($19 charged monthly). The money spent on Stops is spent to preserve and enhance assets. Better stop loss placements can easily translate into far more in profits and savings than the price of using the calculator. A few well-placed stop losses could save many times the cost for a year of use (and pay for many trips to Disneyland).
To download a small Excel 2003 test spreadsheet, click on Get Test Spreadsheet. This is a very simple spreadsheet that tests your software’s ability to perform simple calculations. If you have Excel 2003 or later, you should have no problems, and you almost certainly do not even need to use the test. This test is provided for those who do not have Microsoft’s Excel.
In selecting the stocks to be included in Stops, we conduct the filtering process each day, starting from scratch, so the list may vary in size from day to day and a stock filtered out one day may reappear the next. Before you buy any stock, it is important for you to chart it and check its daily volume to make sure you are not buying a stock that is too thinly traded for the size of the position you wish to take. See the List.
Return to the “Products & Prices” page
IMPORTANT NOTICE. We cannot assume responsibility for the way you use our data. Read our Terms of Use
**The security of information you send us is protected during transmission by using Secure Sockets Layer (SSL) software, which encrypts the information you input. It is the process used by over 93% of the Fortune 500 and by the world’s 40 largest banks. You get 100% secure data transmission.